UNITED STATES
SECURITIES AND EXCHANGE COMMISSION
Washington, D.C. 20549
FORM 6-K
REPORT OF FOREIGN PRIVATE ISSUER
PURSUANT TO RULE 13a-16 OR 15d-16
UNDER THE SECURITIES EXCHANGE ACT OF 1934
For the month of March 2022
Commission File Number: 001-40451
DLocal Limited
(Exact name of registrant as specified in its charter)
Dr. Luis Bonavita 1294
Montevideo
Uruguay 11300
+1 (424) 392-7437
(Address of principal executive office)
Indicate by check mark whether the registrant files or will file annual reports under cover of Form 20-F or Form 40-F:
Form 20-F ☒ Form 40-F ☐
Indicate by check mark if the registrant is submitting the Form 6-K in paper as permitted by Regulation S-T Rule 101(b)(1):
Yes ☐ No ☒
Indicate by check mark if the registrant is submitting the Form 6-K in paper as permitted by Regulation S-T Rule 101(b)(7):
Yes ☐ No ☒
TABLE OF CONTENTS
EXHIBIT
|
|
|
99.1 |
|
Press release dated March 14, 2021 - DLocal Limited Reports 2021 Fourth Quarter and Full Year Financial Results |
|
|
|
99.2 |
|
DLocal Limited Consolidated Financial Statements as of December 31, 2021 and 2020 and for the three years in the period ended December 31, 2021 |
|
|
|
99.3 |
|
Annual Report 2021 - dLocal Reports 2021 Fourth Quarter & full year Financial results |
|
|
|
99.4 |
|
dLocal Q4 & FY2021 Earnings Presentation |
SIGNATURE
Pursuant to the requirements of the Securities Exchange Act of 1934, the registrant has duly caused this report to be signed on its behalf by the undersigned, thereunto duly authorized.
|
DLocal Limited |
|
|
|
|
|
|
|
By: |
/s/ Diego Cabrera Canay |
|
|
Name: |
Diego Cabrera Canay |
|
|
Title: |
Chief Financial Officer |
|
Date: March 15, 2022

dLocal Limited Reports 2021 Fourth Quarter and Full Year Financial Results
Full Year 2021
US$6.0 billion Total Payment Volume, up 193% year-over-year
Revenues of US$244.1 million, up 134% year-over-year
219% Net Retention Rate
41% Adj EBITDA Margin
Fourth Quarter 2021
US$1.9 billion Total Payment Volume, up 145% year-over-year
Revenues of US$76.3 million, up 120% year-over-year
198% Net Retention Rate
38% Adj EBITDA Margin
dLocal reports in US dollars and in accordance with IFRS as issued by the IASB
Montevideo, Uruguay March 14, 2022 — DLocal Limited (“dLocal”, “we”, “us”, and “our”) (NASDAQ:DLO), a technology- first payments platform today announced its financial results for the fourth quarter and full year ended December 31, 2021.
“Dear Customers, Partners and Shareholders,
Thank you for your continued support and trust. We started our journey a little over 6 years ago and we are proud of what we have accomplished till date, but we are literally just getting started. We became Uruguay’s first unicorn and debuted as a public company in June 2021. This has set the beginning of a new chapter for dLocal but our priorities and values have not changed. We remain humble and focused as we continue to turn the complex into simple for our merchants and we continue to redefine the online payments experience in emerging markets.
Our vision is to build a network of payments infrastructure such that making or receiving a payment in the emerging markets to and from anywhere in the world is as simple as sending an email. We are doing this country by country and payment method by payment method. Today, we are in 35 countries and connected to 700+ payment methods.
We started in Uruguay but we were born global. Our first significant win was with a U.S. based enterprise merchant that needed us to solve a local payments problem in Brazil. We then realized that the problem we were solving in Brazil also existed in many other places, so we expanded to Latin America. Our merchants faced the same challenges in the rest of the world, so we expanded to Africa and Asia. We continue to expand our footprint in emerging markets.
2021 was a record year. Our TPV almost tripled in 2021, surpassing the US$6 billion threshold, increasing by 193% year-over-year. Revenues for the year reached US$244 million, a 134% year-over-year growth, with an Adjusted EBITDA margin of 41%, compared to 40% in 2020. We continued to make investments in infrastructure and people to support our expansion strategy. These results were supported by the continued growth from both existing and new merchants using our platform.
We serve online global merchants who are looking to do business in multiple geographies. We are agnostic to industry verticals and have built a diversified business across geographies, sectors, and products. We remain committed to agile decision making and providing tailored solutions for our merchants to help them achieve their growth plans in emerging markets. We are a revenue enabler for our clients, and we grow when they grow. Total merchants on our platform have grown steadily from 300+ in 2020 to 400+ in 2021, and we have a robust sales pipeline ahead. This pipeline is supported mainly by the rapid expansion and ramp up of online merchants, by the consistent growth of the global creator economy and by the increased relevance of digital marketing worldwide, which are not limited by geographic boundaries. During the year, we have seen new companies emerge and establish dominance very quickly, and we expect this trend to continue moving forward.
We have continued to expand our footprint in emerging markets, launching operations in nine new countries (six of them outside Latin America) during 2021, bringing the total number of countries in which we make our services available to 35.
Our culture and our people make us who we are. We pride ourselves on our growth mindset and our ability to be flexible, fast and focused. We believe a high-quality team is the cornerstone for our long-term success. Throughout 2021, we have continued to invest in adding talent, with complementary and diverse backgrounds, reaching 535 employees by the year end, a 73% year-over-year increase.
We have built our company with a long-term vision, and as we look ahead, we are very excited with the opportunities we foresee. We remain focused on creating value for our merchants and our shareholders, and we believe we are in a unique position to capture these opportunities and to continue delivering profitable growth and strong financial results as the years go by,” said Sebastian Kanovich.
Fourth Quarter and Full Year 2021 Financial Highlights
The following table summarizes our key performance metrics:
|
Three months ended |
|
Twelve months ended |
||||
December 31, 2021 |
|
December 31, 2020 |
|
December 31, 2021 |
|
December 31, 2020 |
|
(in millions of US$ except for %) |
|||||||
Key Performance Metrics |
|
|
|
|
|
|
|
TPV |
1,856 |
|
757 |
|
6,049 |
|
2,065 |
TPV growth YoY |
145% |
|
90% |
|
193% |
|
60% |
Revenue |
76.3 |
|
34.7 |
|
244.1 |
|
104.1 |
Revenue growth YoY |
120% |
|
94% |
|
134% |
|
88% |
Adj. EBITDA |
29.1 |
|
13.7 |
|
99.2 |
|
41.9 |
Adj. EBITDA Margin |
38% |
|
39% |
|
41% |
|
40% |
Fourth Quarter and Full Year 2021 Business Highlights
1 Including the effect in 2019 of a warrant with a merchant (valued at US$4.3 million, which was a contra-revenue for such year), the NRR would have been 171%.
Special Note Regarding Adjusted EBITDA and Adjusted EBITDA Margin
dLocal has only one operating segment. dLocal measures its operating segment’s performance by Revenues, Adjusted EBITDA and Adjusted EBITDA Margin, and uses these metrics to make decisions about allocating resources.
Adjusted EBITDA as used by dLocal is defined as the profit from operations before financing and taxation for the year or period, as applicable, before depreciation of property, plant and equipment, amortization of right-of-use assets and intangible assets, and further excluding the changes in fair value of financial assets and derivative instruments carried at fair value through profit or loss, impairment gains/(losses) on financial assets, transaction costs, share-based payment non-cash charges, secondary offering expenses, and inflation adjustment. dLocal defines Adjusted EBITDA Margin as the Adjusted EBITDA divided by consolidated revenues.
Although Adjusted EBITDA and Adjusted EBITDA Margin may be commonly viewed as non-IFRS measures in other contexts, pursuant to IFRS 8, (“Operating Segments”), Adjusted EBITDA and Adjusted EBITDA Margin are treated by dLocal as IFRS measures based on the manner in which dLocal utilizes these measures. Nevertheless, dLocal’s Adjusted EBITDA and Adjusted EBITDA Margin metrics should not be viewed in isolation or as a substitute for net income for the periods presented under IFRS. dLocal also believes that its Adjusted EBITDA and Adjusted EBITDA Margin metrics are useful metrics used by analysts and investors, although these measures are not explicitly defined under IFRS. Additionally, the way dLocal calculates operating segment’s performance measures may be different from the calculations used by other entities, including competitors, and therefore, dLocal’s performance measures may not be comparable to those of other entities.
The table below presents a reconciliation of dLocal’s Adjusted EBITDA and Adjusted EBITDA Margin to net income:
|
Three-months ended December 31 |
Twelve-months ended December 31 |
||
|
2021 |
2020 |
2021 |
2020 |
Profit for the period |
23,549 |
11,601 |
77,853 |
28,187 |
Income tax expense |
2,114 |
1,000 |
7,647 |
3,231 |
Depreciation and amortization |
1,507 |
248 |
4,747 |
992 |
Secondary offering expenses |
716 |
453 |
5,158 |
453 |
Transaction costs |
22 |
158 |
687 |
158 |
Share-based payment non-cash charges |
2,236 |
256 |
7,590 |
7,295 |
Other operating (gain)/loss |
- |
65 |
(2,896) |
2,896 |
Other charges, net |
(1,072) |
(100) |
(1,629) |
(1,281) |
Adjusted EBITDA |
29,072 |
13,681 |
99,157 |
41,931 |
|
|
|
|
|
Revenues |
76,257 |
34,653 |
244,120 |
104,143 |
Adjusted EBITDA |
29,072 |
13,681 |
99,157 |
41,931 |
Adjusted EBITDA Margin |
38.1% |
39.5% |
40.6% |
40.3% |
Earnings per share:
We calculate basic earnings per share by dividing the profit attributable to equity holders by the weighted average number of common shares issued and outstanding during the twelve-months and three-months periods ended December 31, 2021 and 2020.
Our diluted earnings per share is calculated by dividing the profit attributable to equity holders of dLocal by the weighted average number of common shares outstanding during the period plus the weighted average number of common shares that would be issued on conversion of all dilutive potential common shares into common shares.
The next table presents the information used as base for such calculation
|
For the three-month period ended December 31 |
For the twelve-month period ended December 31 |
||
|
2021 |
2020 |
2021 |
2020 |
Profit attributable to common shareholders (U.S. Dollars) |
23,548,950 |
11,601,000 |
77,852,950 |
28,186,840 |
Weighted average number of common shares |
295,028,441 |
268,598,000 |
287,121,304 |
268,598,000 |
Adjustments for calculation of diluted earnings per share |
18,303,500 |
12,964,000 |
21,809,000 |
16,242,000 |
Weighted average number of common shares for calculating diluted earnings per share |
313,331,941 |
281,562,000 |
308,930,304 |
284,840,000 |
Basic earnings per share |
0.08 |
0.04 |
0.27 |
0.10 |
Diluted earnings per share |
0.08 |
0.04 |
0.25 |
0.10 |
This press release does not contain sufficient information to constitute an interim financial report as defined in International Accounting Standards 34, “Interim Financial Reporting” nor a financial statement as defined by International Accounting Standards 1 “Presentation of Financial Statements”. The financial information in this press release has not been audited.
Conference Call and Webcast
dLocal’s management team will host a conference call and audio webcast on March 15, 2022 at 8:30 a.m. Eastern Time. The conference call may be accessed by dialing (888) 705-0197/ (409) 981-0764 (Conference ID – 3689961 –) and requesting inclusion in the call for dLocal.
The live conference call can be accessed via audio webcast at the investor relations section of dLocal’s website, at https://investor.dlocal.com/. An archive of the webcast will be available for a year following the conclusion of the conference call. The investor presentation will also be filed on EDGAR at www.sec.gov.
About dLocal
dLocal powers local payments in emerging markets, connecting global enterprise merchants with billions of emerging market consumers in 35 countries across APAC, the Middle East, Latin America, and Africa. Through the “One dLocal” platform (one direct API, one platform, and one contract), global companies can accept payments, send pay-outs and settle funds globally without the need to manage separate pay-in and pay-out processors, set up numerous local entities, and integrate multiple acquirers and payment methods in each market.
Definition of Selected Operational Metrics
“API” means application programming interface, which is a general term for programming techniques that are available for software developers when they integrate with a particular service or application. In the payments industry, APIs are usually provided by any party participating in the money flow (such as payment gateways, processors, service providers) to facilitate the money transfer process.
“Enterprise Global Merchants” means merchants with at least US$6 million of annual TPV processed through our platform.
“Local payment methods” refers to any payment method that is processed in the country where the end user of the merchant sending or receiving payments is located, which include credit and debit cards, cash payments, bank transfers, mobile money, and digital wallets.
“NRR” means net revenue retention rate, which is the U.S. dollar-based measure of retention and growth of our merchants. We calculate the NRR of a period by dividing the current period revenue by the prior period revenue. The prior period revenue is the revenue billed by us to all of our merchant customers in the corresponding period for the prior fiscal year. The current period revenue is the revenue billed by us in the corresponding period for the current fiscal year to the same merchant customers included in the calculation of the prior period revenue. Current period revenue includes any upsells and cross sells of products, geographies, and payment methods to such merchant customers, and is net of any contractions or attrition, but excludes revenue from new customers on-boarded during the last 12 months.
“Pay-in” means a payment transaction whereby dLocal’s merchant customers receive payment from their customers.
“Pay-out” means a payment transaction whereby dLocal disburses money in local currency to the business partners or customers of dLocal’s merchant customers.
“Revenue from New Merchants”: means the revenue billed by us to merchant customers that we did not bill revenues in the same quarter (or period) of the prior year.
“Revenue from Existing Merchants”: means the revenue billed by us in the last twelve months to the merchant customers that we billed revenue in the same quarter (or period) of the prior year.
Forward Looking Statements
This press release contains certain forward-looking statements. These forward-looking statements convey dLocal’s current expectations or forecasts of future events. Forward-looking statements regarding dLocal involve known and unknown risks, uncertainties and other factors that may cause dLocal’s actual results, performance or achievements to be materially different from any future results, performances or achievements expressed or implied by the forward-looking statements. Certain of these risks and uncertainties are described in the “Risk Factors,” “Forward-Looking Statements” and “Cautionary Note Regarding Forward-Looking Statements” sections of dLocal’s filings with the U.S. Securities and Exchange Commission. Unless required by law, dLocal undertakes no obligation to publicly update or revise any forward-looking statements to reflect circumstances or events after the date hereof.
DLocal Limited
Certain financial information
Consolidated Statements of Comprehensive Income for the three month and twelve month periods ended December 31, 2021 and 2020
(In thousands of U.S. dollars, except per share amounts, unaudited)
|
|
Three-months ended December 31 |
|
Twelve-months ended December 31 |
|
||||
|
|
2021 |
|
2020 |
|
2021 |
|
2020 |
|
Continuing operations |
|
|
|
|
|
|
|
|
|
Revenues |
|
76,257 |
|
34,653 |
|
244,120 |
|
104,143 |
|
Cost of services |
|
(37,316) |
|
(13,981) |
|
(113,677) |
|
(44,065) |
|
Gross profit |
|
38,941 |
|
20,672 |
|
130,443 |
|
60,078 |
|
|
|
|
|
|
|
|
|
|
|
Technology and development expenses |
|
(1,154) |
|
(750) |
|
(3,386) |
|
(2,005) |
|
Sales and marketing expenses |
|
(2,492) |
|
(830) |
|
(5,916) |
|
(2,852) |
|
General and administrative expenses |
|
(10,557) |
|
(6,526) |
|
(40,637) |
|
(22,188) |
|
Impairment (loss)/gain on financial assets |
|
(25) |
|
(45) |
|
(33) |
|
808 |
|
Other operating (loss)/gain |
|
(147) |
|
(65) |
|
3,367 |
|
(2,896) |
|
Operating profit |
|
24,566 |
|
12,456 |
|
83,838 |
|
30,945 |
|
Finance income |
|
1,267 |
|
148 |
|
2,540 |
|
502 |
|
Finance costs |
|
(33) |
|
(7) |
|
(544) |
|
(67) |
|
Inflation adjustment |
|
(137) |
|
4 |
|
(334) |
|
38 |
|
Other results |
|
1,097 |
|
145 |
|
1,662 |
|
473 |
|
Profit before income tax |
|
25,663 |
|
12,601 |
|
85,500 |
|
31,418 |
|
Income tax expense |
|
(2,114) |
|
(1,000) |
|
(7,647) |
|
(3,231) |
|
Profit for the period |
|
23,549 |
|
11,601 |
|
77,853 |
|
28,187 |
|
|
|
|
|
|
|
|
|
|
|
Profit attributable to: |
|
|
|
|
|
|
|
|
|
Owners of the Group |
|
23,585 |
|
11,601 |
|
77,876 |
|
28,184 |
|
Non-controlling interest |
|
(36) |
|
- |
|
(23) |
|
3 |
|
Profit for the period |
|
23,549 |
|
11,601 |
|
77,853 |
|
28,187 |
|
|
|
|
|
|
|
|
|
|
|
Earnings per share (in USD) |
|
|
|
|
|
|
|
|
|
Basic Earnings per share |
|
0.08 |
|
0.04 |
|
0.27 |
|
0.10 |
|
Diluted Earnings per share |
|
0.08 |
|
0.04 |
|
0.25 |
|
0.10 |
|
|
|
|
|
|
|
|
|
|
|
Other comprehensive income |
|
|
|
|
|
|
|
|
|
Items that may be reclassified to profit or loss: |
|
|
|
|
|
|
|
|
|
Exchange difference on translation on foreign operations |
|
(110) |
|
(10) |
|
102 |
|
37 |
|
Other comprehensive income for the period, net of tax |
|
(110) |
|
(10) |
|
102 |
|
37 |
|
|
|
|
|
|
|
|
|
|
|
Total comprehensive income for the period |
|
|
|
|
|
|
|
|
|
Owners of the Group |
|
23,478 |
|
11,594 |
|
77,969 |
|
28,231 |
|
Non-controlling interest |
|
(39) |
|
(3) |
|
(14) |
|
(7) |
|
Total comprehensive income for the period |
|
23,439 |
|
11,591 |
|
77,955 |
|
28,224 |
|
DLocal Limited
Certain financial information
Consolidated Statements of Financial Position as of December 31, 2021 and December 31, 2020
(In thousands of U.S. dollars, except per share amounts, unaudited)
|
|
|
December 31, 2021 |
|
December 31, 2020 |
ASSETS |
|
|
|
|
|
Current Assets |
|
|
|
|
|
Cash and cash equivalents |
|
|
336,197 |
|
111,733 |
Financial assets at fair value through profit or loss |
|
|
1,004 |
|
8,319 |
Trade and other receivables |
|
|
190,966 |
|
72,785 |
Other assets |
|
|
1,339 |
|
2,017 |
Total Current Assets |
|
|
529,506 |
|
194,854 |
|
|
|
|
|
|
Non-Current Assets |
|
|
|
|
|
Deferred tax assets |
|
|
133 |
|
216 |
Property, plant and equipment |
|
|
2,485 |
|
913 |
Right-of-use assets |
|
|
3,915 |
|
188 |
Intangible assets |
|
|
46,969 |
|
4,153 |
Other assets |
|
|
- |
|
143 |
Total Non-Current Assets |
|
|
53,502 |
|
5,613 |
TOTAL ASSETS |
|
|
583,008 |
|
200,467 |
|
|
|
|
|
|
LIABILITIES |
|
|
|
|
|
Current Liabilities |
|
|
|
|
|
Trade and other payables |
|
|
277,160 |
|
142,865 |
Lease liabilities |
|
|
502 |
|
201 |
Tax liabilities |
|
|
13,126 |
|
7,788 |
Derivative financial instruments |
|
|
221 |
|
2,896 |
Borrowings |
|
|
5,014 |
|
- |
Provisions |
|
|
1,710 |
|
1,393 |
Contingent considerations liability |
|
|
665 |
|
- |
Total Current Liabilities |
|
|
298,398 |
|
155,143 |
|
|
|
|
|
|
Non-Current Liabilities |
|
|
|
|
|
Deferred tax liabilities |
|
|
883 |
|
259 |
Lease liabilities |
|
|
3,426 |
|
17 |
Total Non-Current Liabilities |
|
|
4,309 |
|
276 |
TOTAL LIABILITIES |
|
|
302,707 |
|
155,419 |
|
|
|
|
|
|
EQUITY |
|
|
|
|
|
Share Capital |
|
|
590 |
|
602 |
Share Premium |
|
|
157,151 |
|
- |
Capital Reserve |
|
|
12,741 |
|
12,582 |
Other Reserves |
|
|
(30) |
|
119 |
Retained earnings |
|
|
109,867 |
|
31,749 |
Total Equity Attributable to owners of the Group |
|
|
280,319 |
|
45,052 |
Non-controlling interest |
|
|
(18) |
|
(4) |
TOTAL EQUITY |
|
|
280,301 |
|
45,048 |
dLocal was incorporated on February 10, 2021, as a Cayman Islands exempted company with limited liability, duly registered with the Cayman Islands Registrar of Companies. The contribution of dLocal Group Limited (a limited liability company incorporated in Malta, the former holding entity or “dLocal Malta”) shares to dLocal was the Cayman Islands company has been finalized as of April 14, 2021. Until the contribution of dLocal Malta shares to it, dLocal had not commenced operations, consequently the historical information previous to that date presented in here corresponds to dLocal Malta, our predecessor. This reorganization was done, among other things, to facilitate the initial public offering of the Group. dLocal had no prior assets, holdings or operations.
Investor Relations Contact:
investor@dlocal.com
Media Contact:
marketing@dlocal.com
DLocal Limited
Consolidated Financial Statements
as of December 31, 2021 and 2020
and for the three years in the period ended December 31, 2021
INDEX TO CONSOLIDATED FINANCIAL STATEMENTS
|
Page |
|
|
Consolidated Financial Statements as of December 31, 2021 and 2020 and for the three years in the period ended December 31, 2021 |
|
Report of Independent Registered Public Accounting Firm (PCAOB ID1349) |
- |
Consolidated Statements of Comprehensive Income for the years ended December 31, 2021, 2020 and 2019 |
1 |
Consolidated Statements of Financial Position at December 31, 2021 and 2020 |
2 |
Consolidated Statements of Changes in Equity for the years ended December 31, 2021, 2020 and 2019 |
3 |
Consolidated Statements of Cash Flows for the years ended December 31, 2021, 2020 and 2019 |
4 |
5 |

Report of Independent Registered Public Accounting Firm
To the Board of Directors and Shareholders of DLocal Limited
Opinion on the Financial Statements
We have audited the accompanying consolidated statements of financial position of DLocal Limited and its subsidiaries (the “Company”) as of December 31, 2021 and 2020, and the related consolidated statements of comprehensive income, changes in equity and cash flows for each of the three years in the period ended December 31, 2021, including the related notes (collectively referred to as the “consolidated financial statements”). In our opinion, the consolidated financial statements present fairly, in all material respects, the financial position of the Company as of December 31, 2021 and 2020, and the results of its operations and its cash flows for each of the three years in the period ended December 31, 2021 in conformity with International Financial Reporting Standards as issued by the International Accounting Standards Board.
Basis for Opinion
These consolidated financial statements are the responsibility of the Company’s management. Our responsibility is to express an opinion on the Company’s consolidated financial statements based on our audits. We are a public accounting firm registered with the Public Company Accounting Oversight Board (United States) (PCAOB) and are required to be independent with respect to the Company in accordance with the U.S. federal securities laws and the applicable rules and regulations of the Securities and Exchange Commission and the PCAOB.
We conducted our audits of these consolidated financial statements in accordance with the standards of the PCAOB. Those standards require that we plan and perform the audit to obtain reasonable assurance about whether the consolidated financial statements are free of material misstatement, whether due to error or fraud.
Our audits included performing procedures to assess the risks of material misstatement of the consolidated financial statements, whether due to error or fraud, and performing procedures that respond to those risks. Such procedures included examining, on a test basis, evidence regarding the amounts and disclosures in the consolidated financial statements. Our audits also included evaluating the accounting principles used and significant estimates made by management, as well as evaluating the overall presentation of the consolidated financial statements. We believe that our audits provide a reasonable basis for our opinion.
/s/ Price Waterhouse & Co. S.R.L.
Gustavo Ariel Vidan (Partner)
Autonomous City of Buenos Aires, Argentina
March 15, 2022
We have served as the Company’s auditor since 2020.
DLocal Limited
Consolidated Statements of Comprehensive Income
Years ended December 31, 2021, 2020 and 2019
(All amounts in thousands of U.S. Dollars except share data or as otherwise indicated)
|
|
Notes |
|
For the Year Ended December 31, |
|
|||||||||
|
|
|
|
2021 |
|
|
2020 |
|
|
2019 |
|
|||
Continuing operations |
|
|
|
|
|
|
|
|
|
|
|
|||
Revenues |
|
6 |
|
|
244,120 |
|
|
|
104,143 |
|
|
|
55,289 |
|
Cost of services |
|
6 |
|
|
(113,677 |
) |
|
|
(44,065 |
) |
|
|
(19,413 |
) |
Gross profit |
|
|
|
|
130,443 |
|
|
|
60,078 |
|
|
|
35,876 |
|
Technology and development expenses |
|
7 |
|
|
(3,386 |
) |
|
|
(2,005 |
) |
|
|
(1,347 |
) |
Sales and marketing expenses |
|
8 |
|
|
(5,916 |
) |
|
|
(2,852 |
) |
|
|
(2,057 |
) |
General and administrative expenses |
|
8 |
|
|
(40,637 |
) |
|
|
(22,188 |
) |
|
|
(14,101 |
) |
Impairment (loss)/gain on financial assets |
|
16 |
|
|
(33 |
) |
|
|
808 |
|
|
|
(807 |
) |
Other operating gain/(loss) |
|
24 |
|
|
3,367 |
|
|
|
(2,896 |
) |
|
|
— |
|
Operating profit |
|
|
|
|
83,838 |
|
|
|
30,945 |
|
|
|
17,564 |
|
Finance income |
|
11 |
|
|
2,540 |
|
|
|
502 |
|
|
|
279 |
|
Finance costs |
|
11 |
|
|
(544 |
) |
|
|
(67 |
) |
|
|
(30 |
) |
Inflation adjustment |
|
11 |
|
|
(334 |
) |
|
|
38 |
|
|
|
10 |
|
Other results |
|
|
|
|
1,662 |
|
|
|
473 |
|
|
|
259 |
|
Profit before income tax |
|
|
|
|
85,500 |
|
|
|
31,418 |
|
|
|
17,823 |
|
Income tax expense |
|
12 |
|
|
(7,647 |
) |
|
|
(3,231 |
) |
|
|
(2,221 |
) |
Profit for the year |
|
|
|
|
77,853 |
|
|
|
28,187 |
|
|
|
15,602 |
|
Profit attributable to: |
|
|
|
|
|
|
|
|
|
|
|
|||
Owners of the Group |
|
|
|
|
77,876 |
|
|
|
28,184 |
|
|
|
15,602 |
|
Non-controlling interest |
|
|
|
|
(23 |
) |
|
|
3 |
|
|
|
— |
|
Profit for the year |
|
|
|
|
77,853 |
|
|
|
28,187 |
|
|
|
15,602 |
|
Earnings per share |
|
|
|
|
|
|
|
|
|
|
|
|||
Basic Earnings per share |
|
13 |
|
|
0.27 |
|
|
|
0.10 |
|
|
|
0.06 |
|
Diluted Earnings per share |
|
13 |
|
|
0.25 |
|
|
|
0.10 |
|
|
|
0.05 |
|
Other comprehensive Income |
|
|
|
|
|
|
|
|
|
|
|
|||
Items that may be reclassified to profit or loss: |
|
|
|
|
|
|
|
|
|
|
|
|||
Exchange difference on translation on foreign operations |
|
|
|
|
102 |
|
|
|
37 |
|
|
|
27 |
|
Other comprehensive income for the year, net of tax |
|
|
|
|
102 |
|
|
|
37 |
|
|
|
27 |
|
Total comprehensive income for the year |
|
|
|
|
77,955 |
|
|
|
28,224 |
|
|
|
15,629 |
|
Total comprehensive income for the year is attributable to: |
|
|
|
|
|
|
|
|
|
|
|
|||
Owners of the Group |
|
|
|
|
77,969 |
|
|
|
28,231 |
|
|
|
15,629 |
|
Non-controlling interest |
|
|
|
|
(14 |
) |
|
|
(7 |
) |
|
|
— |
|
Total comprehensive income for the year |
|
|
|
|
77,955 |
|
|
|
28,224 |
|
|
|
15,629 |
|
The accompanying notes are an integral part of these consolidated financial statements.
1
DLocal Limited
Consolidated Statements of Financial Position
At December 31, 2021 and 2020
(All amounts in thousands of U.S. Dollars except share data or as otherwise indicated)
|
|
Notes |
|
December 31, |
|
|
December 31, |
|
||
ASSETS |
|
|
|
|
|
|
|
|
||
Current Assets |
|
|
|
|
|
|
|
|
||
Cash and cash equivalents |
|
14 |
|
|
336,197 |
|
|
|
111,733 |
|
Financial assets at fair value through profit or loss |
|
15 |
|
|
1,004 |
|
|
|
8,319 |
|
Trade and other receivables |
|
16 |
|
|
190,966 |
|
|
|
72,785 |
|
Other assets |
|
17 |
|
|
1,339 |
|
|
|
2,017 |
|
Total Current Assets |
|
|
|
|
529,506 |
|
|
|
194,854 |
|
Non-Current Assets |
|
|
|
|
|
|
|
|
||
Deferred tax assets |
|
12 |
|
|
133 |
|
|
|
216 |
|
Property, plant and equipment |
|
18 |
|
|
2,485 |
|
|
|
913 |
|
Right-of-use assets |
|
19 |
|
|
3,915 |
|
|
|
188 |
|
Intangible assets |
|
20 |
|
|
46,969 |
|
|
|
4,153 |
|
Other assets |
|
17 |
|
- |
|
|
|
143 |
|
|
Total Non-Current Assets |
|
|
|
|
53,502 |
|
|
|
5,613 |
|
TOTAL ASSETS |
|
|
|
|
583,008 |
|
|
|
200,467 |
|
LIABILITIES |
|
|
|
|
|
|
|
|
||
Current Liabilities |
|
|
|
|
|
|
|
|
||
Trade and other payables |
|
21 |
|
|
277,160 |
|
|
|
142,865 |
|
Borrowings |
|
22 |
|
|
5,014 |
|
|
|
— |
|
Lease liabilities |
|
19 |
|
|
502 |
|
|
|
201 |
|
Tax liabilities |
|
23 |
|
|
13,126 |
|
|
|
7,788 |
|
Derivative financial instruments |
|
24 |
|
|
221 |
|
|
|
2,896 |
|
Provisions |
|
25 |
|
|
1,710 |
|
|
|
1,393 |
|
Contingent consideration liability |
|
20 |
|
|
665 |
|
|
|
— |
|
Total Current Liabilities |
|
|
|
|
298,398 |
|
|
|
155,143 |
|
Non-Current Liabilities |
|
|
|
|
|
|
|
|
||
Deferred tax liabilities |
|
12 |
|
|
883 |
|
|
|
259 |
|
Lease liabilities |
|
19 |
|
|
3,426 |
|
|
|
17 |
|
Total Non-Current Liabilities |
|
|
|
|
4,309 |
|
|
|
276 |
|
TOTAL LIABILITIES |
|
|
|
|
302,707 |
|
|
|
155,419 |
|
EQUITY |
|
|
|
|
|
|
|
|
||
Share Capital |
|
13 |
|
|
590 |
|
|
|
602 |
|
Share Premium |
|
13 |
|
|
157,151 |
|
|
|
— |
|
Capital Reserve |
|
13 |
|
|
12,741 |
|
|
|
12,582 |
|
Other Reserves |
|
13 |
|
|
(30 |
) |
|
|
119 |
|
Retained earnings |
|
13 |
|
|
109,867 |
|
|
|
31,749 |
|
Total Equity Attributable to owners of the Group |
|
|
|
|
280,319 |
|
|
|
45,052 |
|
Non-controlling interest |
|
|
|
|
(18 |
) |
|
|
(4 |
) |
TOTAL EQUITY |
|
|
|
|
280,301 |
|
|
|
45,048 |
|
The accompanying notes are an integral part of these consolidated financial statements.
2
DLocal Limited
Consolidated Statements of Changes in Equity
Years ended December 31, 2021, 2020 and 2019
(All amounts in thousands of U.S. Dollars except share data or as otherwise indicated)
|
|
Notes |
|
Member |
|
|
Share |
|
|
Share |
|
|
Capital |
|
|
Other Reserves |
|
|
Retained |
|
|
Total |
|
|
Non- |
|
|
Total |
|
|||||||||
Balance as of January 1st, 2021 |
|
|
|
|
— |
|
|
|
602 |
|
|
|
— |
|
|
|
12,582 |
|
|
|
119 |
|
|
|
31,749 |
|
|
|
45,052 |
|
|
|
(4 |
) |
|
|
45,048 |
|
Comprehensive Income for the year |
|
|
|
|
|
|
|
|
|
|
|
|
|
|
|
|
|
|
|
|
|
|
|
|
|
|
|
|
|
|||||||||
Profit of the year |
|
|
|
|
— |
|
|
|
— |
|
|
|
— |
|
|
|
— |
|
|
|
— |
|
|
|
77,876 |
|
|
|
77,876 |
|
|
|
(23 |
) |
|
|
77,853 |
|
Exchange difference on translation on foreign |
|
|
|
|
— |
|
|
|
— |
|
|
|
— |
|
|
|
— |
|
|
|
(149 |
) |
|
|
242 |
|
|
|
93 |
|
|
|
9 |
|
|
|
102 |
|
Total Comprehensive Income for the year |
|
|
|
|
— |
|
|
|
— |
|
|
|
— |
|
|
|
— |
|
|
|
(149 |
) |
|
|
78,118 |
|
|
|
77,969 |
|
|
|
(14 |
) |
|
|
77,955 |
|
Transactions with Group owners in their |
|
|
|
|
|
|
|
|
|
|
|
|
|
|
|
|
|
|
|
|
|
|
|
|
|
|
|
|
|
|||||||||
Initial public offering, net of underwriting discount |
|
13 |
|
|
— |
|
|
|
9 |
|
|
|
86,441 |
|
|
|
— |
|
|
|
— |
|
|
|
— |
|
|
|
86,450 |
|
|
|
— |
|
|
|
86,450 |
|
Issue of ordinary shares |
|
13 |
|
|
— |
|
|
|
45 |
|
|
|
63,132 |
|
|
|
— |
|
|
|
— |
|
|
|
— |
|
|
|
63,177 |
|
|
|
— |
|
|
|
63,177 |
|
Par value change from 1.1211 U.S. Dollars to 1 |
|
13 |
|
|
— |
|
|
|
(70 |
) |
|
|
70 |
|
|
|
— |
|
|
|
— |
|
|
|
— |
|
|
|
— |
|
|
|
— |
|
|
|
— |
|
Share-options exercise |
|
|
|
|
— |
|
|
|
— |
|
|
|
6,979 |
|
|
|
(6,898 |
) |
|
|
— |
|
|
|
— |
|
|
|
81 |
|
|
|
— |
|
|
|
81 |
|
Forfeitures |
|
|
|
|
— |
|
|
|
— |
|
|
|
— |
|
|
|
(6 |
) |
|
|
— |
|
|
|
— |
|
|
|
(6 |
) |
|
|
— |
|
|
|
(6 |
) |
Warrant excercise |
|
13 |
|
|
— |
|
|
|
4 |
|
|
|
529 |
|
|
|
(533 |
) |
|
|
— |
|
|
|
— |
|
|
|
0 |
|
|
|
— |
|
|
|
— |
|
Share-based payments |
|
9 |
|
|
— |
|
|
|
— |
|
|
|
— |
|
|
|
7,596 |
|
|
|
— |
|
|
|
— |
|
|
|
7,596 |
|
|
|
— |
|
|
|
7,596 |
|
Transactions with Group owners in their |
|
|
|
|
— |
|
|
|
(12 |
) |
|
|
157,151 |
|
|
|
159 |
|
|
|
— |
|
|
|
— |
|
|
|
157,298 |
|
|
|
— |
|
|
|
157,298 |
|
Balance as of December 31st, 2021 |
|
|
|
|
— |
|
|
|
590 |
|
|
|
157,151 |
|
|
|
12,741 |
|
|
|
(30 |
) |
|
|
109,867 |
|
|
|
280,319 |
|
|
|
(18 |
) |
|
|
280,301 |
|
Balance as of January 1st, 2020 |
|
|
|
|
602 |
|
|
|
— |
|
|
|
— |
|
|
|
5,287 |
|
|
|
14 |
|
|
|
18,460 |
|
|
|
24,363 |
|
|
|
166 |
|
|
|
24,529 |
|
Adjustments due to reorganizations |
|
|
|
|
(602 |
) |
|
|
602 |
|
|
|
— |
|
|
|
— |
|
|
|
— |
|
|
|
— |
|
|
|
— |
|
|
|
— |
|
|
|
— |
|
Adjusted balance as of January 1st, 2020 |
|
|
|
|
— |
|
|
|
602 |
|
|
|
— |
|
|
|
5,287 |
|
|
|
14 |
|
|
|
18,460 |
|
|
|
24,363 |
|
|
|
166 |
|
|
|
24,529 |
|
Comprehensive Income for the year |
|
|
|
|
|
|
|
|
|
|
|
|
|
|
|
|
|
|
|
|
|
|
|
|
|
|
|
|
|
|||||||||
Profit of the year |
|
|
|
|
— |
|
|
|
— |
|
|
|
— |
|
|
|
— |
|
|
|
— |
|
|
|
28,184 |
|
|
|
28,184 |
|
|
|
3 |
|
|
|
28,187 |
|
Exchange difference on translation on foreign |
|
|
|
|
— |
|
|
|
— |
|
|
|
— |
|
|
|
— |
|
|
|
105 |
|
|
|
(58 |
) |
|
|
47 |
|
|
|
(10 |
) |
|
|
37 |
|
Total Comprehensive Income for the year |
|
|
|
|
— |
|
|
|
— |
|
|
|
— |
|
|
|
— |
|
|
|
105 |
|
|
|
28,126 |
|
|
|
28,231 |
|
|
|
(7 |
) |
|
|
28,224 |
|
Transactions with Group owners in their |
|
|
|
|
|
|
|
|
|
|
|
|
|
|
|
|
|
|
|
|
|
|
|
|
|
|
|
|
|
|||||||||
Share-based payments |
|
9 |
|
|
— |
|
|
|
— |
|
|
|
— |
|
|
|
7,295 |
|
|
|
— |
|
|
|
— |
|
|
|
7,295 |
|
|
|
— |
|
|
|
7,295 |
|
Distribution of retained earnings |
|
13 |
|
|
— |
|
|
|
— |
|
|
|
— |
|
|
|
— |
|
|
|
— |
|
|
|
(15,000 |
) |
|
|
(15,000 |
) |
|
|
— |
|
|
|
(15,000 |
) |
Transaction between shareholders |
|
13 |
|
|
— |
|
|
|
— |
|
|
|
— |
|
|
|
— |
|
|
|
— |
|
|
|
163 |
|
|
|
163 |
|
|
|
(163 |
) |
|
|
— |
|
Transactions with Group owners in their |
|
|
|
|
— |
|
|
|
— |
|
|
|
— |
|
|
|
7,295 |
|
|
|
— |
|
|
|
(14,837 |
) |
|
|
(7,542 |
) |
|
|
(163 |
) |
|
|
(7,705 |
) |
Balance as of December 31st, 2020 |
|
|
|
|
— |
|
|
|
602 |
|
|
|
— |
|
|
|
12,582 |
|
|
|
119 |
|
|
|
31,749 |
|
|
|
45,052 |
|
|
|
(4 |
) |
|
|
45,048 |
|
Balance as of January 1st, 2019 |
|
|
|
|
— |
|
|
|
588 |
|
|
|
— |
|
|
|
238 |
|
|
|
(13 |
) |
|
|
12,858 |
|
|
|
13,671 |
|
|
|
166 |
|
|
|
13,837 |
|
Comprehensive Income for the year |
|
|
|
|
|
|
|
|
|
|
|
|
|
|
|
|
|
|
|
|
|
|
|
|
|
|
|
|
|
|||||||||
Profit of the year |
|
|
|
|
— |
|
|
|
— |
|
|
|
— |
|
|
|
— |
|
|
|
— |
|
|
|
15,602 |
|
|
|
15,602 |
|
|
|
— |
|
|
|
15,602 |
|
Exchange difference on translation on foreign |
|
|
|
|
— |
|
|
|
— |
|
|
|
— |
|
|
|
— |
|
|
|
27 |
|
|
|
— |
|
|
|
27 |
|
|
|
— |
|
|
|
27 |
|
Total Comprehensive Income for the year |
|
|
|
|
— |
|
|
|
— |
|
|
|
— |
|
|
|
— |
|
|
|
27 |
|
|
|
15,602 |
|
|
|
15,629 |
|
|
|
— |
|
|
|
15,629 |
|
Transactions with Group owners in their |
|
|
|
|
|
|
|
|
|
|
|
|
|
|
|
|
|
|
|
|
|
|
|
|
|
|
|
|
|
|||||||||
Share-based payments |
|
9 |
|
|
— |
|
|
|
— |
|
|
|
— |
|
|
|
5,049 |
|
|
|
— |
|
|
|
— |
|
|
|
5,049 |
|
|
|
— |
|
|
|
5,049 |
|
Distribution of retained earnings |
|
13 |
|
|
— |
|
|
|
— |
|
|
|
— |
|
|
|
— |
|
|
|
— |
|
|
|
(10,000 |
) |
|
|
(10,000 |
) |
|
|
— |
|
|
|
(10,000 |
) |
Issue of ordinary shares |
|
13 |
|
|
— |
|
|
|
14 |
|
|
|
— |
|
|
|
— |
|
|
|
— |
|
|
|
— |
|
|
|
14 |
|
|
|
— |
|
|
|
14 |
|
Transactions with Group owners in their |
|
|
|
|
— |
|
|
|
14 |
|
|
|
— |
|
|
|
5,049 |
|
|
|
— |
|
|
|
(10,000 |
) |
|
|
(4,937 |
) |
|
|
— |
|
|
|
(4,937 |
) |
Balance as of December 31st, 2019 |
|
|
|
|
— |
|
|
|
602 |
|
|
|
— |
|
|
|
5,287 |
|
|
|
14 |
|
|
|
18,460 |
|
|
|
24,363 |
|
|
|
166 |
|
|
|
24,529 |
|
The accompanying notes are an integral part of these consolidated financial statements.
3
DLocal Limited
Consolidated Statements of Cash Flows
Years ended December 31, 2021, 2020 and 2019
(All amounts in thousands of U.S. Dollars except share data or as otherwise indicated)
|
|
Notes |
|
2021 |
|
|
2020 |
|
|
2019 |
|
|||
Cash flows from operating activities |
|
|
|
|
|
|
|
|
|
|
|
|||
Profit before income tax |
|
|
|
|
85,500 |
|
|
|
31,418 |
|
|
|
17,823 |
|
Adjustments: |
|
|
|
|
|
|
|
|
|
|
|
|||
Interest income from financial instruments |
|
|
|
|
(2,556 |
) |
|
|
(443 |
) |
|
|
(217 |
) |
Interest charges for lease liabilities |
|
|
|
|
142 |
|
|
|
20 |
|
|
|
30 |
|
Other finance expense / (income) |
|
|
|
|
402 |
|
|
|
(3 |
) |
|
|
(6 |
) |
Amortization of Intangible assets |
|
10 |
|
|
3,917 |
|
|
|
656 |
|
|
|
175 |
|
Depreciation of Property, plant and equipment |
|
10 |
|
|
377 |
|
|
|
155 |
|
|
|
53 |
|
Amortization of Right-of-use asset |
|
10 |
|
|
453 |
|
|
|
181 |
|
|
|
181 |
|
Revenue reduction related to prepaid assets |
|
17 |
|
|
200 |
|
|
|
67 |
|
|
|
— |
|
Share-based payment expense |
|
9 |
|
|
7,590 |
|
|
|
7,295 |
|
|
|
5,049 |
|
Net exchange differences |
|
|
|
|
(19 |
) |
|
|
(99 |
) |
|
|
(106 |
) |
Fair value (loss)/gain on financial assets at fair value through profit or loss |
|
|
|
|
16 |
|
|
|
(9 |
) |
|
|
(56 |
) |
Other operating (gain)/loss |
|
24 |
|
|
(2,896 |
) |
|
|
2,896 |
|
|
|
— |
|
Net Impairment loss/(gain) on financial assets |
|
16 |
|
|
33 |
|
|
|
(808 |
) |
|
|
807 |
|
|
|
|
|
|
93,159 |
|
|
|
41,326 |
|
|
|
23,733 |
|
Changes in working capital |
|
|
|
|
|
|
|
|
|
|
|
|||
Increase in Trade and other receivables |
|
16 |
|
|
(115,355 |
) |
|
|
(45,932 |
) |
|
|
(10,968 |
) |
Increase / (Decrease) in Other assets |
|
17 |
|
|
581 |
|
|
|
(1,114 |
) |
|
|
(1,113 |
) |
Increase in Trade and other payables |
|
21 |
|
|
134,295 |
|
|
|
89,888 |
|
|
|
20,284 |
|
Increase in Tax Liabilities |
|
23 |
|
|
5,309 |
|
|
|
5,877 |
|
|
|
— |
|
Increase in Provisions |
|
25 |
|
|
317 |
|
|
|
595 |
|
|
|
497 |
|
Cash from operating activities |
|
|
|
|
118,306 |
|
|
|
90,640 |
|
|
|
32,433 |
|
Income tax paid |
|
12 |
|
|
(9,820 |
) |
|
|
(2,154 |
) |
|
|
(1,710 |
) |
Net cash from operating activities |
|
|
|
|
108,486 |
|
|
|
88,486 |
|
|
|
30,723 |
|
Cash flows from investing activities |
|
|
|
|
|
|
|
|
|
|
|
|||
Acquisitions of Property, plant and equipment |
|
|
|
|
(1,949 |
) |
|
|
(876 |
) |
|
|
(152 |
) |
Additions of Intangible assets |
|
20 |
|
|
(46,068 |
) |
|
|
(3,006 |
) |
|
|
(1,554 |
) |
Net collections of financial assets at FVPL |
|
|
|
|
7,520 |
|
|
|
7,089 |
|
|
|
1,601 |
|
Interest collected from financial instruments |
|
|
|
|
2,556 |
|
|
|
443 |
|
|
|
217 |
|
Other finance income collected |
|
|
|
|
— |
|
|
|
— |
|
|
|
6 |
|
Net cash (used in) / provided by investing activities |
|
|
|
|
(37,941 |
) |
|
|
3,650 |
|
|
|
118 |
|
Cash flows from financing activities |
|
|
|
|
|
|
|
|
|
|
|
|||
Proceeds from issuance of shares |
|
13 |
|
|
63,177 |
|
|
|
— |
|
|
|
14 |
|
Proceeds from initial public offering |
|
1.3 |
|
|
87,088 |
|
|
|
— |
|
|
|
— |
|
Initial public offering expenses paid |
|
|
|
|
(638 |
) |
|
|
— |
|
|
|
— |
|
Share-options exercise |
|
|
|
|
81 |
|
|
|
— |
|
|
|
— |
|
Dividends paid |
|
|
|
|
— |
|
|
|
(15,000 |
) |
|
|
(10,000 |
) |
Proceeds from borrowings |
|
|
|
|
5,000 |
|
|
|
— |
|
|
|
— |
|
Interest payments on lease liability |
|
|
|
|
(142 |
) |
|
|
(20 |
) |
|
|
(30 |
) |
Principal payments on lease liability |
|
29 |
|
|
(430 |
) |
|
|
(131 |
) |
|
|
(152 |
) |
Payments of loans advanced to shareholders |
|
|
|
|
— |
|
|
|
— |
|
|
|
(9,174 |
) |
Other finance expense paid |
|
|
|
|
(388 |
) |
|
|
(47 |
) |
|
|
— |
|
Net cash provided by / (used in) financing activities |
|
|
|
|
153,748 |
|
|
|
(15,198 |
) |
|
|
(19,342 |
) |
Net increase in cash flow |
|
|
|
|
224,293 |
|
|
|
76,938 |
|
|
|
11,499 |
|
Cash and cash equivalents at the beginning of the year |
|
|
|
|
111,733 |
|
|
|
34,765 |
|
|
|
23,305 |
|
Effects of exchange rate changes on cash and cash equivalents |
|
|
|
|
171 |
|
|
|
30 |
|
|
|
(39 |
) |
Cash and cash equivalents at the end of the year |
|
|
|
|
336,197 |
|
|
|
111,733 |
|
|
|
34,765 |
|
The accompanying notes are an integral part of these consolidated financial statements.
4
DLocal Limited
Notes to the Consolidated Financial Statements
At December 31, 2021
(All amounts in thousands of U.S. Dollars except share data or as otherwise indicated)
1.1 General information
DLocal Limited (“dLocal” or the “Company”) is a holding company, referred to together with its subsidiaries as the “Group”. dLocal is a limited liability company. The Group was established on October 5, 2016, under the holding company dLocal Group Limited, domiciled and incorporated in Malta, and on April 14, 2021 it was reorganized under dLocal, domiciled and incorporated in the Cayman Islands. The Company is the ultimate controlling party of the Group. See detail of subsidiaries in Note 4: Consolidation of subsidiaries.
The Group processes online payment transactions through more than 700 payment methods on December 31, 2021 and 2020, enabling enterprise merchants located in developed economies (mainly United States, Europe and China) to get paid (“payins”) from customers in emerging markets and to make payments (“payouts”) to customers in emerging markets. As of the date of issuance of this Consolidated Financial Statements, the Group continued to focus on its expansion efforts bringing the total number of countries in the geographic network to 35.
In order to conduct its business, the Group has direct connections with banks, acquirers and payments processors to process payments locally in emerging markets. It also operates with financial institutions to expatriate/repatriate the funds to/from the developed economies where the merchant customers elect to settle their funds in the currency of their preference (mainly U.S. Dollar and Euro). These consolidated financial statements include dLocal’s subsidiaries and details of the structure are included under Note 4: Consolidation of subsidiaries.
The Group is licensed and regulated in the EU as an Electronic Money Issuer, or EMI, and Payment Institution, or PI, and registered as a Money Service Business with the Financial Crimes Enforcement Network of the U.S. Department of the Treasury, or FinCEN, and we operate and are licensed, as applicable, in more than 25 countries in emerging markets, primarily in the Americas, Asia and Africa.
In addition, the Group is subject to laws aimed at preventing money laundering, corruption and the financing of terrorism. This regulatory landscape is constantly changing, including as a consequence of the implementation of the Fourth Anti-Money Laundering Directive (Directive 2015/849/EU, “MLD4”) and the proposed amendments to the MLD4, often referred to as the fourth Anti-Money Laundering Directive.
As part of the requirements for maintaining its financial institution license, the subsidiary dLocal Limited is subject to externally imposed capital requirements by the regulator, which initially amounted to Euros 400 (USD 453). As at 31 December 2021 the subsidiary calculated its capital requirement at the level of Euros 530 (USD 600). As at 31 December 2021 Tier 1 Capital was temporarily short in respect of its regulatory capital requirement with an amount of USD 37,666. Such position will be rectified upon the signing of the subsidiary's financial statements, due to the fact that profits registered during the year ended 31 December 2021 will be verified as a result of the external audit of the financial statements of the subsidiary, and Tier 1 Capital post verification will be considered to be that of USD 4,621, which is in excess of the externally imposed minimum capital requirement of Euros 530 (USD 600).
1.2 Reorganization
On April 14, 2021, in a series of transactions as further described below, the owners of dLocal Group Limited completed the contribution of 100% of their respective interests in dLocal Group Limited, with par value 1.1211 U.S. Dollars per share, on a pro rata basis to a newly formed entity, dLocal, in exchange for 100% of the common shares of dLocal, with par value 1 U.S. Dollars per share with no additional consideration, is defined as the “Reorganization”. The purpose of the Reorganization was to facilitate the initial public offering of the Group. dLocal had no prior assets, holdings or operations.
In connection with the Reorganization, the Group amended its existing employee share incentive plan, the “2020 Global Share Incentive Plan”. In this context, all obligations of dLocal Group Limited under this plan (including award agreements issued thereunder) have been transferred to dLocal, and options to purchase ordinary shares of dLocal Group Limited have been converted into options to purchase ordinary shares of dLocal. The conversion was based on a ratio intended to maintain in all material respects the same, and in no event greater, economic benefit to optionees as provided under the plans in effect prior to the Reorganization.
5
Additionally, the written resolution of dLocal’s shareholders dated May 19, 2021 and effective June 2, 2021, approved a 500-for-1 stock split of dLocal’s common shares, whereby every share of capital stock of dLocal was converted into 500 shares, changing the par value of dLocal’s common shares from 1 U.S. Dollars to 0.002 U.S. Dollars. Therefore, dLocal increased total shares outstanding from 577,008 shares to 288,504,000 shares. Consequently the 2020 Global Share Incentive Plan was also amended to reflect such change in the par value of the common shares. References made to outstanding shares and per share amounts in the accompanying financial statements and applicable disclosures have been retroactively adjusted to reflect this stock split.
The Reorganization was limited to entities which were all under the control of the same shareholder group and was implemented in part to facilitate the IPO, it did not qualify as a business combination under common control; rather, it was a Reorganization of the capital of dLocal Group Limited, the existing organization. Therefore, all financial and other information herein relating to December 2020 and 2019 are presented using the historical values from the consolidated financial statements of dLocal Group Limited. However, the issued share capital reflects that of Dlocal as of the Reorganization date.
1.3 Significant events during the year
a) Filing of Form S-8
Effective November 26, 2021, the Company filed a Form S-8 with the SEC, which allows dlocal to register securities it offers as part of its employee benefit plan.
b) Secondary offering
On October 25, 2021 the Company announced the closing of an underwritten public offering of 17,000,000 Class A common shares which were sold by certain selling shareholders at a public offering price of USD 52.25 per share. The offering was made pursuant to a registration statement on Form F-1 filed with the U.S. Securities and Exchange Commission (“SEC”). This public offering was secondary for which the Company did not receive any cash in exchange of shares.
In connection with the offering, the selling shareholders have granted the underwriters the option to purchase up to 2,550,000 additional Class A common shares at the public offering price less the underwriting discounts and commissions.
See Note 8.iv).
c) Warrant exercise
On September 2, 2021 a holder of warrants exercised its net issuance right resulting in a net issuance on September 7, 2021 of 2,112,676 shares at a Fair Market Value of U.S. Dollars 65.14 per share, calculated using the average price of 5 business days before the exercise date.
d) Initial Public Offering (IPO)
On June 3, 2021, the Company successfully completed an initial public offering of its shares on the Nasdaq Global Select Market. The Company issued 4,411,765 shares, at a price of 21 U.S. Dollars per share prior to the underwriting discount of 6%. In addition, on June 3, 2021 the over-allotment option was exercised by the underwriters of the initial public offering on a secondary offering.
e) Acquisition of certain assets from PrimeiroPay
On March 11, 2021, dLocal signed a contract to acquire certain assets (mainly merchant agreements) from Primeiropay S.A.R.L and PrimeiroPay Technology GmbH (“Primeiropay”) in accordance to the Transfer of a Going Concern Agreement signed between the parties. The purchase of this acquisition of assets amounted to 40 million U.S. Dollars, of which 1.33 million U.S. Dollars is contingent consideration (subject to the achievement of the “earn-out”) and 38.67 million U.S. Dollars was an immediate cash consideration, with an effective date of April 1, 2021. On August 31, 2021 the earn-out period finalized and the earn-out conditions were not achieved. However, the merchant contracts migration from Primeiropay to Dlocal is in progress, as a consequence the recognized contingent liability, capped in USD 665 thousands, is expected to be paid conditioned to finalizing the migration process estimated during 2022.
Primeiropay is an international payment service provider that delivers payment services for international merchants that want to accept payments from their international customers without setting up a local entity through processing all cards and payment methods domestically in local currencies. The concentration test outlined on IFRS 3 was met and therefore the transaction was classified as an asset acquisition. For further details refer to Note 20: Intangible assets.
6
f) Loan related to Employee share purchase plan (ESPP)
In November 2020 dLocal Group Limited signed a non-recourse “Loan Agreement” with two officers to fund the acquisition of shares under the ESPP.
During March and April 2021, dLocal received payments for USD 31,644 (equivalent to 15,459,000 common shares) that were considered as the collection of the exercise price of the options under the ESPP for the issuance of shares. Therefore, dLocal recognized for such collections the cash inflow against equity. As of the date of issuance of this Consolidated Financial Statements, the loan and the corresponding accrued interest had been fully repaid.
g) Coronavirus pandemic
As of the date of these Consolidated Financial Statements, the impact of the COVID-19 pandemic on our operations has had a different impact across our different product offerings and the different verticals the Group serves, with certain industries benefiting from increased adoption (e.g., retail, streaming, gaming, social media) while others suffering initially from decreased usage (e.g., travel, ride hailing), however subsequently recovered to its pre pandemic volumes.
The Group business has far exhibited a net benefit from the shift from in-store shopping and traditional payment methods towards e-commerce and digital payments (and overall higher exposure to online industries benefiting from increased adoption), the ultimate extent to which the COVID-19 pandemic impacts dLocal’s business, financial condition, and results of operations will depend on future developments, which are highly uncertain, difficult to predict, and subject to change, including, but not limited to, the duration, scope, severity, and geographic spread of the outbreak, its impact on the global economy, actions taken to contain or limit the impact of COVID-19, such as the availability of vaccines or treatments, geographic variation in how countries and states are handling the pandemic, the appearance of new variants of the virus, and how quickly and to what extent normal economic and operating conditions may potentially resume.
The Group continues to believe that even if the pandemic may adversely affect the Group in the short-term, in the long-term the Group’s assets will be preserved and consequently the going concern basis applied to these financial statements is still applicable.
2.1. Basis of preparation of the Consolidated Financial Statements
These Consolidated Financial Statements have been prepared in accordance with International Financial Reporting Standards (“IFRS”) and interpretations issued by the IFRS Interpretations Committee (IFRS I C) applicable to companies reporting under IFRS. These Consolidated Financial Statements comply with IFRS as issued by the International Accounting Standards Board (“IASB”). The Consolidated Financial Statements are presented in thousands of U.S. Dollars, except for share data or as otherwise indicated, which is the functional currency of dLocal Limited.
The Consolidated Financial Statements have been prepared on a historical cost basis, except for certain financial assets measured at fair value as explained in Note 2.5: Financial instruments-initial recognition and measurement, and for the Financial Statements of Argentine operations that were adjusted upon IAS 29 requirements as detailed in Note 2.3 Foreign currencies.
The preparation of Financial Statements requires the use of certain critical accounting estimates. It also requires management to exercise its judgment in the process of applying dLocal’s accounting policies. The areas involving a higher degree of judgment or complexity, or areas where assumptions and estimates are significant to the Financial Statements, are disclosed in Note 3: Accounting estimates and judgments.
As mentioned in Note 1.2, a written resolution of dLocal’s shareholders dated May 19, 2021 and effective June 2, 2021, approved a 500-for-1 stock split of dLocal’s common shares, whereby every share of capital stock of dLocal was converted into 500 shares, increasing the authorized share capital to 1,500,000,000 common shares and changing the par value of the common shares from $1.00 to $0.002. As a result, the share capital previously represented by 577,008 common shares was increased to 288,504,244 common shares. The stock split affected all of our existing shareholders uniformly and did not affect any individual shareholder’s percentage ownership interest in the company. References made to outstanding shares and per share amounts in the accompanying financial statements and applicable disclosures have been retroactively adjusted to reflect this stock split.
These Consolidated Financial Statements as of December 31, 2021, were approved by dLocal’s Board of Directors on March 14, 2022.
7
2.2. Basis of consolidation
Business combinations
The Group accounts for business combinations using the acquisition method when control is transferred to the Group. The consideration transferred in the acquisition is generally measured at fair value, as are the identifiable net assets acquired. Any goodwill that arises is tested annually for impairment. Any gain on a bargain purchase is recognized in profit or loss immediately. Transaction costs are expensed as incurred, except if they are related to the issue of debt or equity instruments.
The consideration transferred does not include amounts related to the settlement of pre-existing relationships. Such amounts are generally recognized in profit or loss.
Any contingent consideration payable is measured at fair value at the acquisition date. If the contingent consideration is classified as equity, then it is not remeasured, and settlement is accounted for within equity. Otherwise, subsequent changes in the fair value of the contingent consideration are recognized in profit or loss.
There were no significant business combinations during 2021 and 2020.
Subsidiaries
The Group consolidates all entities over which it has control. Control is achieved when the Group is exposed to, or has rights to, variable returns from its involvement with the entity and has the ability to affect those returns through its power to direct the activities of the entity. Inter-company transactions, balances, income and expenses on transactions between Group companies are eliminated.
Subsidiaries are all entities over which dLocal has control. Subsidiaries are fully consolidated from the date dLocal obtains control of the subsidiary and ceases when dLocal loses control of the subsidiary. The subsidiaries included in the consolidation are described in Note 4: Consolidation of subsidiaries.
A change in the ownership interest of a subsidiary, without a loss of control, is accounted for as an equity transaction.
2.3. Foreign currencies
i) Functional and presentation currency
Items included in the Financial Statements of each of the Group’s entities are measured using the currency of the primary economic environment in which the entity operates (‘the functional currency’). The consolidated financial statements are presented in U.S. Dollar, which is dLocal’s functional and presentation currency.
ii) Transactions and balances
Foreign currency transactions are translated into the functional currency using the exchange rates at the dates of the transactions. Foreign exchange gains and losses resulting from the settlement of such transactions, and from the translation of monetary assets and liabilities denominated in foreign currencies at year end exchange rates, are generally recognized in profit or loss.
The Group adopts an allocation policy for foreign exchange differences in order to allocate them to the various line items of its financial statements, based on the nature of the item that generated the exchange difference. For example, exchange differences on trade payables arising from the purchase of services and exchange differences from payins and payouts transactions are included as part of Cost of services while exchange differences arising from loans are allocated to Finance costs. This policy is applied consistently from period to period.
Non-monetary items that are measured at fair value in a foreign currency are translated using the exchange rates at the date when the fair value was determined. Translation differences on assets and liabilities carried at fair value are reported as part of the fair value gain or loss. For example, translation differences on non-monetary assets and liabilities such as equities held at fair value through profit or loss are recognized in profit or loss as part of the fair value gain or loss, and translation differences on non-monetary assets such as equities classified as at fair value through other comprehensive income are recognized in other comprehensive income. Foreign exchange gains and losses resulting from the measurement at period end exchange rates of monetary assets denominated in foreign currencies and measured at fair value through other comprehensive income are recognized in the statement of income.
iii) Argentine operations
Argentina is one of the principal markets of the Group’s business, as measured by revenue. Recently, the economic environment in Argentina has been volatile with weak economic conditions, devaluation of local currency, high interest rates, high level of inflation and a large public deficit which led Argentina to request financial assistance from the International Monetary Fund.
8
The Group applied IAS 29 “Financial Reporting in Hyperinflationary Economies” (“ IAS 29”) to its operations in Argentina. IAS 29 establishes that financial statements of entities whose functional currency is that of a hyperinflationary economy must be adjusted for the effects of changes in the general price index and expressed in terms of the current unit of measurement at the closing date of the reporting period. In order to determine whether an economy is categorized as hyperinflationary under the terms of IAS 29, the standard details a series of factors to be considered, including the existence of a cumulative inflation rate in three years that approximates or exceeds 100%. Argentina experienced a significant increase in inflation during 2018, which exceeded the 100% three-year cumulative inflation rate. The three-year cumulative inflation is expected to significantly exceed 100% at December 31, 2020 and is expected to remain significantly above that threshold in future years.
IAS 29 requires adjustments to non-monetary items in the statement of financial position by applying a general price index from the day they were booked until the end of the reporting period. Additionally, it also requires that all items in the statement of comprehensive income are expressed in terms of the measuring unit current at the end of the reporting period.
The inflation adjustment on the initial balances as of December 31, 2019 and 2020 were calculated by means of conversion factor derived from the Argentine price indexes published by the Argentine Federation of Professional Councils of Economic Sciences National Institute of Statistics (“FACPCE”). The price index for the year ended December 31, 2021, was 1.5 (1.36 and 1.54 for the years ended December 31, 2020 and 2019, respectively).
Results of operations in Argentine Pesos, after adjustment for inflation pursuant to IAS 29, were then converted into U.S. Dollars at the closing exchange rate for such reported period. This process is called “translation”.
iv) Group companies
The results and financial position of foreign operations of non-hyperinflationary economies that have a functional currency different from the presentation currency are translated into the presentation currency as follows:
The results and financial position of foreign operations whose functional currency is the currency of a hyperinflationary economy are translated into the presentation currency as follows:
On consolidation, exchange differences arising from the translation of foreign entities are recognized in other comprehensive income. When a foreign operation is sold or any borrowings forming part of the net investment are repaid, the associated exchange differences are reclassified to profit or loss, as part of the gain or loss on sale.
9
The following is the detail of the exchange rates of the main currencies used by the Group compared to the USD in the year ended December 31, 2021 and 2020:
|
|
Average rate |
|
|
Year-end spot rate |
|
||||||||||
|
|
2021 |
|
|
2020 |
|
|
Dec 31, 2021 |
|
|
Dec 31, 2020 |
|
||||
Argentina (ARS/USD) |
|
|
94.9 |
|
|
|
71.9 |
|
|
|
102.6 |
|
|
|
84.1 |
|
Brazil (BRL/USD) |
|
|
5.4 |
|
|
|
4.6 |
|
|
|
5.6 |
|
|
|
5.2 |
|
Chile (CLP/USD) |
|
|
758.5 |
|
|
|
730.0 |
|
|
|
850.3 |
|
|
|
711.2 |
|
Colombia (COP/USD) |
|
|
3,741.8 |
|
|
|
3,354.8 |
|
|
|
3,981.2 |
|
|
|
3,432.5 |
|
Ecuador (USD/USD) |
|
|
1.0 |
|
|
|
1.0 |
|
|
|
1.0 |
|
|
|
1.0 |
|
Egypt (EGP/USD) |
|
|
15.7 |
|
|
|
15.8 |
|
|
|
15.8 |
|
|
|
15.7 |
|
India (IRN/USD) |
|
|
72.2 |
|
|
|
72.2 |
|
|
|
74.3 |
|
|
|
73.1 |
|
Israel (NIS/USD) |
|
|
3.1 |
|
|
|
3.3 |
|
|
|
3.0 |
|
|
|
3.2 |
|
Malta (EUR/USD) |
|
|
0.8 |
|
|
|
0.8 |
|
|
|
0.8 |
|
|
|
0.8 |
|
Mexico (MXN/USD) |
|
|
20.5 |
|
|
|
19.4 |
|
|
|
20.3 |
|
|
|
19.9 |
|
Morocco (MAD/USD) |
|
|
9.2 |
|
|
|
9.2 |
|
|
|
9.2 |
|
|
|
8.9 |
|
Panama (USD/USD) |
|
|
1.0 |
|
|
|
1.0 |
|
|
|
1.0 |
|
|
|
1.0 |
|
Peru (PEN/USD) |
|
|
4.0 |
|
|
|
3.5 |
|
|
|
3.9 |
|
|
|
3.6 |
|
Uruguay (UYU/USD) |
|
|
44.7 |
|
|
|
39.8 |
|
|
|
43.6 |
|
|
|
42.3 |
|
2.4. Cash and cash equivalents
Cash and cash equivalents include cash in hand, deposits held at call with banks and other short-term highly liquid financial instruments with original maturities of three months or less. dLocal classifies as cash equivalents a financial instrument that can be immediately converted into a known amount of cash and the fair value approximates the carrying value. dLocal cash and cash equivalents are measured at amortized cost and are included in current assets due to their short-term nature.
2.5. Financial instruments - initial recognition and subsequent measurement
i) Financial assets
Initial recognition and measurement
Financial assets are classified, at initial recognition and subsequently measured at amortized cost, fair value through other comprehensive income (“OCI”), and fair value through profit or loss (“FVPL”).
The classification of financial assets at initial recognition depends on the financial asset’s contractual cash flow characteristics and the Group’s business model for managing them. The Group initially measures a financial asset at its fair value plus, in the case of a financial asset not at fair value through profit or loss, transaction costs. Except for trade receivables that do not contain a significant financing component or for which the Group has applied the practical expedient, the Group initially measures a financial asset at its fair value plus transaction costs, in the case of a financial asset not at FVPL. Trade receivables that do not contain a significant financing component or for which the Group has applied the practical expedient are measured at the transaction price determined under IFRS 15-Revenue from Contracts with Customers.
In order for a financial asset to be classified and measured at amortized cost or fair value through OCI, it needs to give rise to cash flows that are solely payments of principal and interest (“SPPI”) on the principal amount outstanding. This assessment is referred to as the SPPI test and is performed at an instrument level. Financial assets with cash flows that are not SPPI are classified and measured at fair value through profit or loss, irrespective of the business model.
The Group’s business model for managing financial assets refers to how it manages its financial assets in order to generate cash flows. The business model determines whether cash flows will result from collecting contractual cash flows, selling the financial assets, or both. Financial assets classified and measured at amortized cost are held within a business model with the objective to hold financial assets in order to collect contractual cash flows while financial assets classified and measured at fair value through OCI are held within a business model with the objective of both holding to collect contractual cash flows and selling.
Financial assets as of December 31, 2021 and 2020 include cash and cash equivalents, trade and other receivables and investments in quoted debt securities.
10
Subsequent measurement
The subsequent measurement of financial assets depends on their classification, which may be (i) financial assets at amortized cost; (ii) financial assets at fair value through OCI with recycling of cumulative gains and losses (debt instruments); (iii) financial assets designated at fair value through OCI with no recycling of cumulative gains and losses upon derecognition (equity instruments); and (iv) financial assets at fair value through profit or loss.
Financial assets at amortized cost
Financial assets at amortized cost are subsequently measured using the effective interest method and are subject to impairment.
The Group’s financial assets at amortized cost for 2021 and 2020 include cash and cash equivalents, restricted cash (included in Other Assets) and trade and other receivables which correspond to receivables fee from merchants originated from transactions through dLocal’s payment and collection platform as well as receivables from payment processors and preferred suppliers.
Financial assets at fair value through profit or loss
Financial assets through profit or loss consist of equity investments that are held for trading, debt securities that do not qualify for measurement at either amortized cost or fair value through other comprehensive income, and equity investments for which the company has not elected to recognize fair value gains and losses through other comprehensive income.
The Group’s financial assets at fair value through profit or loss as of December 31, 2021 and 2020 include investment in quoted debt securities. On disposal of any of the above investments, any gains or losses are recognized in the profit and loss.
Financial assets at fair value through OCI
For debt instruments at fair value through OCI, interest income, foreign exchange gains and losses and impairment losses or reversals are recognized in the statement of comprehensive income and computed in the same manner as for financial assets measured at amortized cost. The remaining fair value changes are recognized in OCI. Upon derecognition, the cumulative fair value change recognized in OCI is recycled to profit or loss. The Group did not hold any financial assets within this category as of December 31, 2021 or 2020.
Financial assets designated at fair value through OCI (equity instruments)
Upon initial recognition, the Group can elect to irrevocably present in other comprehensive income subsequent changes in the fair value of its equity investments when they meet the definition of equity under IAS 32 Financial Instruments: Presentation and are not held for trading. This election is made on an instrument-by-instrument basis. Gains and losses on these financial assets are never recycled to profit or loss. The Group did not hold any financial asset within this category as of December 31, 2021 or 2020.
Derecognition
A financial asset or, where applicable, a part of a financial asset or part of a group of similar financial assets, is derecognized when:
When dLocal has transferred its rights to receive cash flows from an asset and has not transferred or retained substantially all the risks and benefits of the asset, this asset is recognized to the extent of dLocal’s continuing involvement in the asset. In such case, dLocal also recognizes an associated liability.
The transferred asset and the associated liability are measured on a basis that reflects the rights and obligations that dLocal Group has retained.
Continuing involvement that takes the form of a guarantee over the transferred asset is measured at the lower of the original carrying amount of the asset and the maximum amount of the consideration that dLocal may be required to repay.
ii) Impairment of financial assets
11
dLocal assesses, at the reporting date, if there is objective evidence that a financial asset or a group of financial assets is impaired. The Group recognizes an allowance for expected credit losses (“ECLs”) for all debt instruments not held at fair value through profit or loss.
ECLs are based on the difference between the cash flows contractually due and all the cash flows that the Group expects to receive, discounted at the original effective interest rate. The expected cash flows will include cash flows from the sale of collateral held or other credit enhancements that are integral to the contractual terms.
The Group applies a simplified approach on trade and other receivables in calculating ECLs, therefore, the Group does not track changes in credit risk, but instead recognizes a loss allowance based on lifetime ECLs and on segmentation of trade receivables. The Group uses historical loss experience in trade receivables and adjusts historical loss rates to reflect information about current conditions and reasonable and bearable forecasts of future economic conditions.
iii) Financial liabilities
Initial recognition and measurement
Financial liabilities are classified, at initial recognition, as financial liabilities at fair value through profit or loss, amortized cost or as derivatives designated as hedging instruments in an effective hedge, as appropriate.
All financial liabilities are recognized initially at fair value and, in the case of amortized cost, net of directly attributable transaction costs.
The Group’s financial liabilities as of December 31, 2021 include trade and other payables and borrowings. As of December 31, 2020, financial liabilities included trade and other payables.
Subsequent measurement
The subsequent measurement of financial liabilities depends on their classification, as described below:
Financial liabilities at fair value through profit or loss
Financial liabilities at fair value through profit or loss include held-for-trading financial liabilities and financial liabilities designated at fair value through profit or loss at initial recognition.
Financial liabilities are classified as held-for-trading if they are incurred for the purpose of repurchasing in the near term. This category also includes derivative financial instruments entered by the Group that are not designated as hedging instruments in hedge relationships as defined by IFRS 9- Financial Instruments.
Gains and losses on held-for-trading liabilities are recognized in the statement of comprehensive income.
The Group did not have these types of liabilities during 2021 or 2020.
Financial liabilities at amortized cost
After initial recognition, interest-bearing borrowings are subsequently measured at amortized cost, using the effective interest rate (“EIR”) method. Gains and losses are recognized in profit or loss when the liabilities are derecognized as well as through the EIR amortization process. This category is the most relevant to the Group.
Amortized cost is calculated by considering any discount or premium on acquisition and fees or costs that are an integral part of the effective interest rate. The effective interest rate amortization is included in “Financial expenses” in the statement of comprehensive income.
This category for 2021 and 2020 includes all trade and other payables which represent liabilities for goods and services that have been acquired in the ordinary course of business from suppliers and short term financial liabilites. The amounts are unsecured and are usually paid within 30 days of recognition. Trade and other payables are presented as current liabilities unless payment is not due within 12 months after the reporting period.
The book value of trade payables approximates their fair value due to their short-term nature.
12
Derecognition
A financial liability is derecognized when the obligation under the liability is discharged or cancelled or expires. When an existing financial liability is replaced by another from the same lender on substantially different terms, or the terms of an existing liability are substantially modified, such an exchange or modification is treated as the derecognition of the original liability and the recognition of a new liability. The difference in the respective carrying amounts is recognized in the statement of comprehensive income.
iv) Derivative financial instruments
Derivative financial instruments are initially recognized at fair value on the date on which a derivative contract is entered and are subsequently remeasured at fair value. Derivatives are carried as financial assets when the fair value is positive and as financial liabilities when the fair value is negative.
The Group operates in several foreign currencies and consequently is exposed to foreign currency risk. From time to time, the Group uses derivative financial instruments, such as delivery and non-deliverable forward currency contracts to hedge or reduce exposure to foreign currency risks. For information about derivative financial instruments see Note 24: Derivative financial instruments.
In addition, the Group had an option agreement in place with one shareholder (“Investor”), more fully explained in Note 24, pursuant to which the Investor has outstanding options to purchase shares that are classified as derivative financial liability instruments at the end of the year. dLocal acts as a guarantor for the obligations assumed by certain shareholders and the liability arises due to the potential issue of shares on a cashless basis.
Accordingly, these outstanding derivatives were recognized in the Group’s consolidated balance sheet at fair value through profit or loss, where results and changes in fair value from these contracts are recorded in financial income or loss.
v) Fair value of financial instruments
The Group measures its financial assets at fair value through profit or loss at fair value at each reporting date.
Fair value is the price that would be received to sell an asset or paid to transfer a liability in an orderly transaction between market participants at the measurement date. The fair value measurement is based on the presumption that the transaction to sell the asset or transfer the liability takes place either:
The principal or the most advantageous market must be accessible by the Group.
The fair value of an asset or a liability is measured using the assumptions that market participants would use when pricing the asset or liability, assuming that market participants act in their economic best interest. The Group uses valuation techniques that are appropriate in the circumstances and for which sufficient data are available to measure fair value, maximizing the use of relevant observable inputs and minimizing the use of unobservable inputs.
All assets and liabilities for which fair value is measured or disclosed in the financial statements are categorized within the fair value hierarchy, described as follows, based on the lowest level input that is significant to the fair value measurement as a whole:
The Group uses observable market data to the extent possible. For assets and liabilities that are recognized in the financial statements at fair value on a recurring basis, the Group determines whether transfers have occurred between levels in the hierarchy by re-assessing categorization (based on the lowest level input that is significant to the fair value measurement as a whole) at the end of each reporting period.
13
vi) Current versus non-current classification
The Group presents financial assets and liabilities in the statement of financial position based on current and non-current classification. An asset is current when it is: (i) expected to be realized or intended to be sold or consumed in the normal operating cycle; (ii) expected to be realized within twelve months after the reporting period; (iii) held primarily for the purpose of trading; or (iv) cash or cash equivalent unless restricted from being exchanged or used to settle a liability for at least twelve months after the reporting period. All other assets are classified as non-current.
A liability is current when: (i) it is expected to be settled in the normal operating cycle; (ii) it is due to be settled within twelve months after the reporting period; (iii) it is held primarily for the purpose of trading; or (iv) there is no unconditional right to defer the settlement of the liability for at least twelve months after the reporting period. All other liabilities are classified as non-current.
i) Financial instruments-offsetting
Financial assets and liabilities are presented net in the consolidated statement of financial position if, and only if, there is an existing and enforceable legal right to offset the amounts recognized and an intention to offset or to realize the asset and settle the liability simultaneously.
The Group presents trade payables to Merchants net of trade receivables from fees and trade receivables from processing entities net of fees considering that there is an enforceable legal right to offset and the Group expects to cancel such obligations on a net basis. For further detail refer to Note 26: Offsetting financial assets and financial liabilities.
2.6. Current and deferred income tax
Current and deferred income tax are recognized in profit or loss except to the extent that it relates to items recognized directly in equity or in other comprehensive income.
Current income tax
Tax assets and liabilities for the current year are calculated based on the expected recoverable amount or the amount payable to the tax authorities on the taxable income or loss for the period, using tax rates enacted or substantively enacted at the reporting date in the countries where dLocal operates and generates taxable income.
Current income tax related to items recognized directly in equity are recognized in equity. dLocal periodically evaluates the tax positions involving interpretation of tax regulations and establishes provisions when appropriate.
The Group offsets current tax assets and current tax liabilities against the same tax authority when it has a legally enforceable right to set off current tax assets against current tax liabilities.
Deferred income tax
Deferred income tax is recognized in respect of temporary differences between the carrying amounts of assets and liabilities for financial reporting purposes and the amounts used for taxation purposes.
Deferred income tax assets and liabilities are recognized for all temporary taxable differences, except in the following situations:
Deferred income tax is measured at the tax rates that are expected to be applied to temporary differences when they reverse, using tax rates enacted or substantively enacted at the reporting date and tax loss carryforwards, to the extent that it is probable that taxable profit will be available against which they can be offset.
The carrying amount of deferred income tax assets is reviewed at each reporting date to assess whether it is probable that sufficient taxable profit will be available to allow all or part of the deferred tax assets to be utilized. Unrecognized deferred tax assets are reassessed, at each reporting date, and are recognized to the extent that it has become probable that future taxable profits will be available to allow their utilization.
14
2.7. Property, plant and equipment
Property, plant and equipment are stated at historical cost, net of accumulated depreciation and accumulated impairment losses, if any, except for items in this category of the Argentine operations that were adjusted upon IAS 29 requirements as detailed in Note 2.3 Foreign currencies. Historical cost includes expenditures that are directly attributable to the acquisition of the items and the cost of the item is material and can be measured reliably. Repairs and maintenance and all other expenditures are charged to profit or loss during the period in which they are incurred.
Subsequent costs are included in the asset’s carrying amount or recognized as a separate asset, as appropriate, only when it is probable that future economic benefits associated with these costs will flow to dLocal and that such benefits can be reliably measured. The carrying amount of replaced items or parts is derecognized. All other repairs and maintenance expenses are charged to the statement of comprehensive income during the year in which they are incurred.
The assets’ residual values and useful lives are reviewed at the end of each reporting period, and adjusted on a prospective basis, if appropriate. Depreciation is calculated on a straight-line basis over the estimated useful lives of the asset, as follows:
Computer Equipment |
3 years |
Building Improvements |
10 years |
As described in Note 19: Leases, during 2020 the Group signed a contract modification on a lease and incurred in costs for the design and construction of the new offices, such as professional fees of architects and construction suppliers as well as costs of building materials. Such costs were not contingent on obtaining the lease, did not influence the lease contract negotiation and therefore did not qualify as initial direct cost to be included in the right-of -use asset initial measurement. Accordingly, these costs were recognized as “Work in progress” and transferred to a new Property, plant and equipment line item called “Building Improvements” when the asset was ready for use. These assets will be amortized using the straight-line method, over the shorter of the estimated useful life of the asset or the remaining term of the lease.
An item of property, plant and equipment is derecognized upon disposal or when future economic benefits are expected from its use or disposal.
Any gain or loss on disposal (calculated as the difference between the net disposal proceeds with the carrying amount of the asset) is recognized within “Other gains- net” in the statement of comprehensive income when an asset is derecognized.
An asset’s carrying amount is immediately written down to its recoverable amount when the asset’s carrying amount is greater than its estimated recoverable amount. For further information see Note 2.9: Impairment of non-financial assets.
2.8. Intangible assets
Externally acquired intangible assets are initially recognized at cost and subsequently amortized on a straight-line basis over their useful economic lives, up to three years. As mentioned in Note 20: Intangible assets, during year 2021 Dlocal acquired certain intangible assets that are amortized on a straight-line bases in 18.75 years.
dLocal’s business is based on digital products and services used to facilitate commercial relationships between international merchants and their customers in emerging markets. dLocal is continuously developing future product releases, enhancements and upgrades to existing software and maintenance oriented to bug fixes for existing products. Internal costs associated with the development of software and projects for which there is a likelihood that future economic benefits will arise are capitalized and amortized over their useful life.
Costs associated with maintaining computer software programs are recognized as an expense as incurred. Development costs that are directly attributable to the design and testing of identifiable and unique software products controlled by dLocal are recognized as intangible assets. Directly attributable costs relating to internal development of software are capitalized as part of the software product, which mainly includes costs incurred with employees and third-party contracted services.
The expenses capitalized are only related to the development phase and are capitalized only if the Group can demonstrate the following:
15
Other development expenditures that do not meet the capitalization criteria are expensed as incurred.
Development costs previously recorded as an expense are not recognized as an asset in a subsequent period and are included in the statements of comprehensive income mainly within salaries and wages item. Capitalized computer software development costs are amortized over their estimated useful lives which are reviewed at the end of each reporting period, and adjusted on a prospective basis, if appropriate. dLocal amortizes capitalized software development costs on a straight-line basis over a period of up to three years. Management believes this is a reasonable estimated useful life based on an assessment evaluating expected usage of the asset.
2.9. Impairment of non-financial assets
dLocal considers the ability of the asset to generate future economic benefits related to the internal use of it in the development of dLocal business. The future economic benefits arise from making the service attractive for new or existing merchants, reducing costs by the elimination of unnecessary activities, among others.
An assessment is made at each reporting date to determine whether there is an indication that an asset may be impaired or to determine whether previously recognized impairment losses no longer exist or have decreased. If any indication exists, the Group estimates the asset’s recoverable amount. The recoverable amount is determined for an individual asset, unless the asset does not generate cash inflows that are largely independent of those from other assets or groups of assets.
In determining fair value less costs of disposal, recent market transactions are considered. If no such transactions can be identified, an appropriate valuation model is used. These calculations are corroborated by valuation multiples or other available fair value indicators.
In assessing value in use, the estimated future cash flows are discounted to their present value using a pre-tax discount rate that reflects current market assessments of the time value of money and the risks specific to the asset.
The Group did not record an impairment for non-financial assets during 2021, 2020 and 2019.
2.10. Provisions
Provisions are recognized when the Group has a present legal or constructive obligation as a result of past events, it is probable that an outflow of resources will be required to settle the obligation, and the amount can be reliably estimated. Provisions are not recognized for future operating losses.
Where there are a number of similar obligations, the likelihood that an outflow will be required in settlement is determined by considering the class of obligations as a whole. A provision is recognized even if the likelihood of an outflow with respect to any one item included in the same class of obligations may be small.
Provisions are established for all contingencies related to lawsuits or claims for which it is probable that an outflow of funds will be necessary to settle the contingency/obligation and a reasonable estimate can be made.
The assessment of the likelihood of loss includes the evaluation of available evidence, the hierarchy of laws, available case law, recent court decisions and their importance in the legal system, as well as the opinion of outside legal counsel. The provisions are reviewed and adjusted to reflect changes in circumstances.
Provisions are measured at the present value of management’s best estimate of the expenditure required to settle the present obligation at the end of the reporting period. The discount rate used to determine the present value is a pre-tax rate that reflects current market assessments of the time value of money and the risks specific to the liability. The increase in the provision due to the passage of time is recognized as interest expense. Provisions are disclosed in the statement of financial position according to its nature.
16
2.11. Share-based payments and warrants
2.11.1. General description - Share-based payments
Share-based compensation benefits are provided to certain key employees via dLocal’s Employee Share Purchase Plan (“ESPP”) composed of the “Ordinary A Share Purchase Agreement and the Share Restriction Agreement”, several “Share Option Award Agreements” (together referred to as the “Agreements”) and shares granted by the "dLocal Limited amended and restricted 2020 Global Share Incentive Plan" mentioned in note 1.2.
Under these Agreements, some members of the executive management team as defined by the Board of Directors, were granted share options or shares in return for their services to the Group.
dLocal receives services in exchange for its own equity instruments and does not have any obligation to settle the obligation with cash, so the Plan shall be classified as equity settled. The only condition to be met is the delivery of service by the employee during a certain period as defined in the Agreements.
The fair value of options granted under ESPP is measured at grant date and recognized in accordance with the requirements of IFRS 2, as an employee benefits expense, with a corresponding increase in equity.
The total expense is recognized over the vesting period using a graded attribution model, which is the period over which all of the specified vesting conditions are to be satisfied.
When the options are exercised, dLocal issues the shares to the employee. The proceeds received, net of any directly attributable transaction costs, are credited directly to equity.
2.11.2. General description - Warrants
During 2019 the Group issued a warrant (the “Warrant”) to one of its merchants (the “Merchant”) to acquire up to 17,345,000 ordinary shares exercisable through January 24, 2026 at a purchase price per share of either (1) U.S. Dollars 0.57 or (2) upon any reorganization (including any change of control) of the Company, the lesser of (i) U.S. Dollars 0.57 and (ii) sixty percent (60%) of the price per share paid in or implied by such transaction.
The Warrant is exercisable for ordinary shares, either for cash or on a net issuance basis with no net cash proceeds to the Company. The number of ordinary shares to be issued on a net issuance basis is the quotient obtained by dividing (i) the product of the number of ordinary shares as to which the Merchant exercises the Warrant multiplied by the difference between the fair market value per ordinary share at the time of exercise and the exercise price by (ii) the fair market value per ordinary share at the time of exercise.
The Warrant limits the Merchant’s beneficial ownership to 4.999% of the outstanding ordinary shares unless the Merchant waives this limit upon 61 days’ notice.
Concurrent with the Warrant issuance, the Company and the Merchant entered into a service agreement. The Company has determined the Warrant is (i) a payment to a customer related to a revenue contract under IFRS 15, and (ii) an equity-settled share-based payment under IFRS 2. Accordingly, the fair market value of the Warrant was deducted from revenue at the inception of the service agreement.
On September 2, 2021, the holder of the warrant excercised part of the ordinary shares, as described in Note 1.3.c).
2.11.3. Employee Share Purchase Plan (“ESPP”)
Under the Group‘s ESPP certain employees can purchase shares subject to a payment defined in their Share Award Agreement.
In November 2020 dLocal Group Limited signed a non-recourse “Loan Agreement” with two officers in order to fund the shares acquisition under the ESPP. The loan amounted to USD 31.5 million, accrues interest at a nominal annual rate of 1.5%.
Considering the substance of this transaction it was accounted as an option plan. In this sense, neither the shares nor the loan, are outstanding until either the options are exercised by paying the exercise price for the shares - i.e. by repaying the loan - or the options expire. Accordingly, until exercise of the options, the shares ‘issued’ to employees are treated as treasury shares and no financial asset for the loan receivable from the employees is recognized until this time. The loan agreement was cancelled during 2021, as detailed in Note 1.3.f).
17
Set out below are summaries of options granted under the plan:
|
|
2021 |
|
|
2020 |
|
||||||||||
|
|
Average |
|
|
|
|
|
Average |
|
|
|
|
||||
|
|
exercise price |
|
|
|
|
|
exercise price |
|
|
|
|
||||
|
|
per share |
|
|
|
|
|
per share |
|
|
|
|
||||
|
|
option |
|
|
Number of |
|
|
option |
|
|
Number of |
|
||||
|
|
(U.S. Dollars) |
|
|
options and RSUs |
|
|
(U.S. Dollars) |
|
|
options |
|
||||
At the beginning of the year |
|
|
1.22 |
|
|
|
17,361,000 |
|
|
|
1.22 |
|
|
|
406,500 |
|
Granted during the year |
|
|
3.69 |
|
|
|
2,371,345 |
|
|
|
2.17 |
|
|
|
16,954,500 |
|
Exercised during the year |
|
|
2.03 |
|
|
|
(15,685,000 |
) |
|
|
— |
|
|
|
— |
|
Forfeited during the year |
|
|
4.15 |
|
|
|
(15,000 |
) |
|
|
— |
|
|
|
— |
|
At the end of the year |
|
|
1.16 |
|
|
|
4,032,345 |
|
|
|
2.15 |
|
|
|
17,361,000 |
|
Vested and exercisable at the end of the year |
|
|
3.54 |
|
|
|
486,750 |
|
|
|
2.02 |
|
|
|
15,685,000 |
|
No options expired during the periods covered by the above table.
Share options outstanding at the end of the year have the following expiry dates and exercise prices:
Grant date |
|
Vesting period |
|
Expiry date |
|
Exercise price |
|
|
Share options and |
|
|
Share options and |
|
|||
August 1st, 2018 |
|
3 years |
|
August 1st, 2021 |
|
|
0.74 |
|
|
|
90,500 |
|
|
|
271,500 |
|
October 1st, 2019 |
|
3 years |
|
October 1st, 2022 |
|
|
2.18 |
|
|
|
90,000 |
|
|
|
135,000 |
|
January 31st, 2020 |
|
Less than 1 year |
|
December 31st, 2024 |
|
|
2.04 |
|
|
|
— |
|
|
|
15,459,000 |
|
August 24th, 2020 |
|
5 years |
|
August 24th, 2025 |
|
|
3.30 |
|
|
|
835,000 |
|
|
|
835,000 |
|
November 15th, 2020 |
|
4 years |
|
November 15th, 2024 |
|
|
4.15 |
|
|
|
135,000 |
|
|
|
135,000 |
|
November 23rd, 2020 |
|
5 years |
|
November 23rd, 2025 |
|
|
3.88 |
|
|
|
525,500 |
|
|
|
525,500 |
|
January 1st, 2021 |
|
5 years |
|
January 1st, 2026 |
|
|
3.88 |
|
|
|
210,000 |
|
|
|
— |
|
March 1st, 2021 |
|
1 year |
|
March 1st, 2022 |
|
|
0.002 |
|
|
**5,500 |
|
|
|
— |
|
|
March 2nd, 2021 |
|
5 years |
|
March 2nd, 2026 |
|
|
7.44 |
|
|
|
10,000 |
|
|
|
— |
|
March 11th, 2021 |
|
5 years |
|
March 11th, 2026 |
|
|
0.002 |
|
|
**1,031,000 |
|
|
|
— |
|
|
March 11th, 2021 |
|
5 years |
|
March 11th, 2026 |
|
|
7.44 |
|
|
|
36,000 |
|
|
|
— |
|
March 12nd, 2021 |
|
5 years |
|
March 12nd, 2026 |
|
|
7.44 |
|
|
|
7,000 |
|
|
|
— |
|
March 15th, 2021 |
|
5 years |
|
March 15th, 2026 |
|
|
7.44 |
|
|
|
7,500 |
|
|
|
— |
|
March 29th, 2021 |
|
5 years |
|
March 29th, 2026 |
|
|
7.44 |
|
|
|
10,000 |
|
|
|
— |
|
May 11th, 2021 |
|
5 years |
|
May 11th, 2026 |
|
|
7.44 |
|
|
|
927,500 |
|
|
|
— |
|
May 11th, 2021 |
|
3 years |
|
May 11th, 2024 |
|
|
0.002 |
|
|
**22,500 |
|
|
|
— |
|
|
May 18th, 2021 |
|
5 years |
|
May 18th, 2026 |
|
|
16.17 |
|
|
|
10,000 |
|
|
|
— |
|
December 9th, 2021 |
|
5 years |
|
December 9th, 2026 |
|
|
0.002 |
|
|
**79,345 |
|
|
|
— |
|
|
Total |
|
|
|
|
|
|
|
|
|
4,032,345 |
|
|
|
17,361,000 |
|
|
|
|
|
|
|
|
|
|
|
|
|
|
|
|
|||
Weighted average remaining contractual life of restricted share units and share options outstanding at end of the year |
|
|
|
|
4.24 years |
|
|
4.02 years |
|
|||||||
* |
Retroactively adjusted to reflect the effect of the stock split (Note 1). |
** |
It corresponds to Restricted Share Units ("RSUs") granted. |
18
2.11.4. Warrant agreement
Set out below is a summary of the warrants granted:
|
|
2021 |
|
|
2020 |
|
||||||||||
|
|
Average |
|
|
|
|
|
Average |
|
|
|
|
||||
|
|
exercise price |
|
|
|
|
|
exercise price |
|
|
|
|
||||
|
|
per share |
|
|
|
|
|
per share |
|
|
|
|
||||
|
|
warrant |
|
|
Number of |
|
|
warrant |
|
|
Number of |
|
||||
|
|
(U.S. Dollars) |
|
|
warrants |
|
|
(U.S. Dollars) |
|
|
warrants |
|
||||
As at January 1 |
|
|
0.57 |
|
|
|
17,345,000 |
|
|
|
0.57 |
|
|
|
17,345,000 |
|
Granted during the year |
|
|
— |
|
|
|
— |
|
|
|
— |
|
|
|
— |
|
Exercised during the year |
|
|
0.57 |
|
|
|
(2,131,413 |
) |
|
|
— |
|
|
|
— |
|
As at December 31 |
|
|
0.57 |
|
|
|
15,213,587 |
|
|
|
0.57 |
|
|
|
17,345,000 |
|
Vested and exercisable at December 31 |
|
|
0.57 |
|
|
|
15,213,587 |
|
|
|
0.57 |
|
|
|
17,345,000 |
|
No warrants expired during the periods covered by the above table.
All warrants expire on January 1, 2026.
2.12. Leases and right of use assets
dLocal recognizes the liability of the future payments and the right of use of the leased asset for virtually all lease contracts, including operating leases. Lease payments to be made under reasonably certain extension options are also included in the measurement of the liability. Short-term and low-value contracts are recognized as an expense in the Consolidated Statement of Comprehensive Income as they accrue. dLocal’s leasing policy is described in detail in Note 19: Leases.
2.13. Equity
Ordinary shares are classified as equity and incremental costs directly attributable to the issue of new shares or options are shown in equity as a deduction, net of tax, from the proceeds.
Provision is made for the amount of any dividend declared, being appropriately authorized and no longer at the discretion of the entity, on or before the end of the reporting period but not distributed at the end of the reporting period.
dLocal calculates and presents basic and diluted earnings per share (“EPS”) information for its ordinary shares. The calculation of earnings per share is the following:
a. Profit for the year attributable to shareholders, by
b. the weighted average number of outstanding ordinary shares outstanding during the period.
a. Profit for the year attributable to shareholders, by
b. the weighted average number of outstanding ordinary shares outstanding during the period, adjusted by dilutive effects.
2.14. Revenue
dLocal provides payment processing services to merchants as follows:
19
dLocal earns revenues from fees charged to merchants in connection with payment processing services for cross-border and local payment transactions in emerging markets. These fees are primarily generated on a per approved transaction basis as either a fixed fee per transaction or fixed percentage per transaction. dLocal also earns additional fees on cross-border transactions (i.e., transactions in which the merchant and its customer are in different countries) for which we perform foreign currency conversion and transfer of funds between the merchant home country and the emerging market country where the end user is.
Foreign currency conversion fees are usually determined based on a fixed percentage of the transaction value. dLocal’s service offering comprises a single performance obligation to complete payments via its platform for merchants and their customers.
Revenues from contracts with customers are recognized as control of services are transferred to the customer at an amount that reflects the consideration to which the Group expects to be entitled in exchange for those services in the ordinary course of Group’s activities.
The Group applies the following five steps:
dLocal performs two types of transactions:
Our contracts with merchants are usually open-ended and can be terminated by either party without a termination penalty after the notice period has lapsed. Our contracts are, therefore, defined at the transaction level and do not extend beyond the service already provided.
Revenue from contracts with merchants comprises:
Transaction revenues
We recognize fees charged to merchants as transaction revenue and fees we incur in processing payments as cost of services. Fees earned from merchants are presented as revenue due to the following considerations which indicate we control the payment processing services:
20
Transaction revenues are recognized as revenue at a point in time when an authorized payment transaction is processed.
Other revenues
Other revenues are mainly composed of minor fees, such as an initial setup fee, installment fee, minimum monthly fee, chargebacks fee, refunds fee and small transfer fees. Other revenues are recognized at a point in time when the respective performance obligation is satisfied.
2.15. New accounting pronouncements
The accounting policies and methods of computation adopted in the preparation of these consolidated financial statements are consistent with those followed in the preparation of the Group annual consolidated financial statements for the year ended December 31, 2020.
The Group has not early adopted any standard, interpretation or amendment that has been issued but is not yet effective. A number of new or amended standards became applicable for the current reporting period. The Group did not change its accounting policies or make retrospective adjustments as a result of new accounting standards made applicable on January 1, 2021.
The qualitative impact assessment of the first-time application on January 1, 2021 of new amendments is disclosed below:
Effective for Periods beginning on or after January l, 2021
The following new standard has been issued by IASB and is effective for the twelve-month ended December 31, 2021. As required by IAS 8, the nature and effect of these changes are disclosed below. Those changes, however, did not have material impacts on the consolidated financial statements.
Interbank Offered Rates “IBOR” reform and its effects on financial report – phase 2
‘Phase 2’ of the amendments requires that, for financial instruments measured using amortized cost measurement (that is, financial instruments classified as amortized cost and debt financial assets classified as Fair Value through Other Comprehensive Income “FVOCI”), changes to the basis for determining the contractual cash flows required by interest rate benchmark reform is reflected by adjusting their effective interest rate. No immediate gain or loss is recognized. A similar practical expedient exists for lease liabilities. These expedients are only applicable to changes that are required by interest rate benchmark reform, which is the case if, and only if, the change is necessary as a direct consequence of interest rate benchmark reform and the new basis for determining the contractual cash flows is economically equivalent to the previous basis (that is, the basis immediately preceding the change).
Where some or all of a change in the basis for determining the contractual cash flows of a financial asset and liability do not meet the above criteria, the above practical expedient is first applied to the changes required by interest rate benchmark reform, including updating the instrument’s effective interest rate. Any additional changes are accounted for in the normal way (that is, assessed for modification or derecognition, with the resulting modification gain/loss, recognized immediately in profit or loss where the instrument is not derecognized).
For lease liabilities where there is a change to the basis for determining the contractual cash flows, as a practical expedient the lease liability is remeasured by discounting the revised lease payments using a discount rate that reflects the change in the interest rate where the change is required by IBOR reform. If lease modifications are made in addition to those required by IBOR reform, the normal requirements of IFRS 16 are applied to the entire lease modification, including those changes required by IBOR reform.
21
The Group adopted amendments to IFRS 9, IAS 39, IFRS 7, and IFRS 16 Interest Rate Benchmark Reform – Phase 2 as issued in August 2020. All the amendments listed above did not have any impact on the amounts recognized in prior periods and are not expected to significantly affect the current or future periods.
New accounting pronouncements
The Company has not applied the following new and revised IFRSs that have been issued but are not yet mandatorily effective:
Amendments to IAS 8 Definition of Accounting Estimates (1)
Amendments to IAS 1 and IFRS Practice Statement 2 Disclosure of Accounting Policies (1)
Amendments to IFRS 16 Covid-19-Related Rent Concessions beyond 30 June 2021(2) Amendments to IAS 12 Deferred Tax related to Assets and Liabilities arising from a Single Transaction (1)
(1) Effective for annual reporting periods beginning on or after January 1, 2023. Earlier application is permitted.
(2) Effective for annual reporting periods beginning on or after April 1, 2021. Earlier application is permitted.
• On February 12, 2021, IASB issued 'Definition of Accounting Estimates (Amendments to IAS 8)' providing a new definition of accounting estimates to help entities to distinguish between accounting policies and accounting estimates. The management of the Company does not anticipate that the application of this amendment will have a material impact on the Company's consolidated financial statements. This amendment is effective for annual periods beginning on or after January 1, 2023. Earlier application is permitted. The Company has not opted for early application.
• On February 12, 2021, the IASB issued 'Disclosure of Accounting Policies (Amendments to IAS 1 and IFRS Practice Statement 2)' to help preparers in deciding which accounting policies to disclose in their financial statements. The management of the Company does not anticipate that the application of this amendment will have a material impact on the Company's consolidated financial statements. This amendment is effective for annual periods beginning on or after January 1, 2023. Earlier application is permitted. The Company has not opted for early application.
• On March 31, 2021, IASB issued 'Covid-19-Related Rent Concessions beyond 30 June 2021 (Amendments to IFRS 16)' extending, by one year, the May 2020 amendment that provides lessees with an exemption from assessing whether a COVID-19-related rent concession is a lease modification.
• The management of the Company does not anticipate that the application of this amendment will have a material impact on the Company's consolidated financial statements. This amendment is effective for annual periods beginning on or after April 1, 2021 Earlier application is permitted. The Company has not opted for early application.
• On May 7, 2021, the International Accounting Standards Board (the “IASB”) issued 'Deferred Tax related to Assets and Liabilities arising from a Single Transaction (Amendments to IAS 12)' clarifying that the initial recognition exemption does not apply to transactions in which equal amounts of deductible and taxable temporary differences arise on initial recognition.
This amendment is effective for annual periods beginning on or after January 1, 2023. Earlier application is permitted. The Company has not opted for early application.
Accounting estimates and judgments are continually evaluated and are based on historical experience and other factors, including expectations of future events that are believed to be reasonable under the circumstances.
Based on assumptions, dLocal makes estimates concerning the future. The resulting accounting estimates will, by definition, seldom equal the related actual results. The main estimates and assumptions are addressed below:
3.1. Deferred income tax
dLocal recognizes deferred income tax based on future taxable profit estimates for the next five years using significant judgment from management to determine the amount of deferred tax assets that can be recognized, based on the likely timing and level of future taxable profits, together with future tax planning strategies. These projections are periodically reviewed and approved by management.
22
3.2. Provisions
dLocal recognizes provisions for labor contingent claims. The assessment of the probability of a past event that gives rise to a present obligation of labor lawsuits and claims includes assessing the available evidence and jurisprudence, the hierarchy of laws and most recent court decisions. In order to conclude that assessment, management applies its professional judgment also based on its legal advisors’ opinion.
Provisions are reviewed and adjusted to consider changes in circumstances such as the applicable limitation period, findings of inspections and additional exposures identified based on new issues or court decisions.
3.3. Share-based payment transactions to employees and warrant agreement
dLocal estimates share-based payment transactions and warrant agreements using the most appropriate valuation model and underlying assumptions, which depend on the terms and conditions of the grant and the information available at the grant date.
The Group uses certain methodologies to estimate fair value of the options and warrants granted which include the following:
These estimates also require determination of the most appropriate inputs to the valuation models including assumptions regarding the expected life of a share option and warrants and expected volatility of the price of the Group’s shares.
The model inputs for options granted during the year ended December 31, 2021 included:
The model inputs for options granted during the year ended December 31, 2020 included:
The expected price volatility is based on the historic volatility (based on the remaining life of the options), adjusted for any expected changes to future volatility based on publicly available information.
The model inputs for the warrants granted during the year ended December 31, 2019 included:
23
The expected price volatility is based on the historic volatility (based on the remaining life of the options), adjusted for any expected changes to future volatility based on publicly available information.
During 2021 and 2020 the Group did not grant warrants.
3.4. Fair value measurement of financial instruments
When the fair values of financial assets and financial liabilities recorded in the statement of financial position cannot be measured based on quoted prices in active markets, their fair value is measured using valuation techniques, including the discounted cash models.
The inputs to these models are taken from observable markets where possible, but where this is not feasible, a degree of judgement is required in establishing fair values. Judgements include considerations of inputs such as liquidity risk, credit risk and volatility.
Changes in assumptions relating to these factors could affect the reported fair value of financial instruments.
3.5. Derivative financial instruments
dLocal estimates the fair value of derivative financial instruments using the most appropriate valuation model and underlying assumptions, which depends on the terms and conditions and the information available.
These estimates require determination of the most appropriate inputs to the valuation techniques including assumptions regarding the expected life of a derivative financial instrument and expected volatility of the price of the Group’s shares.
The model inputs for measuring the fair value of the derivative financial instrument during the year ended December 31, 2021 included:
The model inputs for options granted during the year ended December 31, 2020 included:
24
The expected price volatility is based on the historic volatility (based on the remaining life of the options), adjusted for any expected changes to future volatility based on publicly available information.
In addition, see Note 24: Derivative financial instruments.
dLocal Limited, located in Cayman Islands, is the parent company of the Group and acts as a holding company for subsidiaries whose main activity is cross-border and local payments, enabling international merchants to access end customers in emerging markets. Its revenue comes from dividends receivable from subsidiaries and share of profit from subsidiary partnership.
The consolidated financial statements of the Group include the following subsidiaries:
|
|
|
|
|
|
% of equity interest held by Dlocal |
|
|||
Entity name |
|
Country of incorporation |
|
Principal activities |
|
2021 |
|
2020 |
|
|
Dlocal Group Limited (1) |
|
Malta |
|
Holding Company |
|
100% |
|
100% |
|
|
Dlocal Limited |
|
Malta |
|
Payments provider |
|
99.999% |
|
99.999% |
|
|
Dlocal LLP |
|
United Kingdom |
|
Payments provider |
|
99.999% |
|
99.999% |
|
|
Dlocal Corp LLP |
|
United Kingdom |
|
Payments provider |
|
99.99% |
|
99.99% |
|
|
Dlocal Inc. |
|
United States of America |
|
Holding Company |
|
100% |
|
100% |
|
|
Dlocal PTE Limited |
|
Singapore |
|
Holding Company |
|
100% |
|
100% |
|
|
Dlocal Technologies S.A. |
|
Uruguay |
|
Service provider |
|
100% |
|
100% |
|
|
Dlocal Markets Limited |
|
Malta |
|
Holding Company |
|
100% |
|
100% |
|
|
Dlocal Israel Limited |
|
Israel |
|
Service provider |
|
100% |
|
100% |
|
|
Dlocal Brasil Instituição de Pagamento S.A. |
|
Brazil |
|
Collection agent |
|
100% |
|
100% |
|
|
Demerge Brasil Facilitadora de Pagamentos Ltda. |
|
Brazil |
|
Collection agent |
|
100% |
|
100% |
|
|
Dlocal Brasil Holding Financeira |
|
Brazil |
|
Holding Company |
|
100% |
|
|
— |
|
Dlocal Argentina S.A. |
|
Argentina |
|
Collection agent |
|
100% |
|
100% |
|
|
Demerge Argentina S.A. |
|
Argentina |
|
Service provider |
|
100% |
|
|
— |
|
Demerge Mexico S.A. de C.V. |
|
Mexico |
|
Collection agent |
|
99.999% |
|
99.999% |
|
|
Dlocal Mexico S.A. DE C.V. |
|
Mexico |
|
Collection agent |
|
99.999% |
|
99.999% |
|
|
Dlocal Technologies Mexico S.A. DE C.V. |
|
Mexico |
|
Service provider |
|
100% |
|
|
— |
|
Dlocal Chile SPA |
|
Chile |
|
Collection agent |
|
100% |
|
100% |
|
|
Demerge Chile SPA |
|
Chile |
|
Collection agent |
|
100% |
|
|
— |
|
Pagos y Servicios Limitada |
|
Chile |
|
Collection agent |
|
100% |
|
100% |
|
|
Dlocal Colombia S.A.S. |
|
Colombia |
|
Collection agent |
|
100% |
|
100% |
|
|
Demerge Colombia S.A.S. |
|
Colombia |
|
Collection agent |
|
100% |
|
100% |
|
|
W-Collect S.A.S. |
|
Colombia |
|
Collection agent |
|
100% |
|
|
— |
|
BH Collect S.A.S. |
|
Colombia |
|
Collection agent |
|
100% |
|
|
— |
|
Demerge Peru S.A.C. |
|
Peru |
|
Collection agent |
|
99% |
|
99% |
|
|
Depansum Solutions Private Limited |
|
India |
|
Collection agent |
|
99% |
|
99% |
|
|
Dlocal Uruguay S.A. |
|
Uruguay |
|
Collection agent |
|
100% |
|
100% |
|
|
Demerege Ecuador S.A. (2) |
|
Ecuador |
|
Collection agent |
|
0.15% |
|
0.15% |
|
|
PT Dlocal Solutions Indonesia |
|
Indonesia |
|
Collection agent |
|
100% |
|
100% |
|
|
DLocal Bangladesh Limited |
|
Bangladesh |
|
Collection agent |
|
100% |
|
100% |
|
|
Dlocal Egypt LLC |
|
Egypt |
|
Collection agent |
|
100% |
|
100% |
|
|
DLocal Morocco SARL AU |
|
Morocco |
|
Collection agent |
|
100% |
|
100% |
|
|
Demerge Nigeria Limited |
|
Nigeria |
|
Collection agent |
|
100% |
|
100% |
|
|
Dlocal Panama S.A. |
|
Panama |
|
Collection agent |
|
100% |
|
100% |
|
|
Dlocal Paraguay S.A. |
|
Paraguay |
|
Collection agent |
|
100% |
|
|
— |
|
Demerge República Dominicana SAS |
|
República Dominicana |
|
Collection agent |
|
99.99% |
|
|
— |
|
Depansum PTY Limited |
|
South Africa |
|
Collection agent |
|
100% |
|
|
— |
|
Dlocal India Pvt Limited |
|
India |
|
Collection agent |
|
99.99% |
|
|
— |
|
Dlocal Services Arg S.A. |
|
Argentina |
|
Service provider |
|
100% |
|
|
— |
|
(1) Dlocal Group Limited is the former parent company of the Group, see Note 1.2: Reorganization.
(2) Although Dlocal is the owner of 0.15% of Demerge Ecuador S.A., the Group controls its operations according to the guidelines in IFRS 10.
The Group operates in a single operating segment, which is “payment processing”. Operating segments are defined as components of an enterprise for which separate financial information is regularly evaluated by the chief operating decision maker, who in the Group’s case is the Executive Team, in deciding how to allocate resources and assess performance. The Executive Team is composed of the
25
Chief Executive Officer (“CEO”), the President of Dlocal Limited, the Chief Operating Officer (“COO”) and the Chief Financial Officer (“CFO”).
The Executive Team evaluates the Group’s financial information and resources and assess the financial performance of these resources on a consolidated basis on the basis of Revenues, Adjusted EBITDA and Adjusted EBITDA margin as further described below.
The Group’s revenue, results and assets for this one reportable segment can be determined by reference to the Consolidated Statement of Comprehensive Income and Consolidated Statement of Financial Position.
As required by IFRS 8 Operating Segments, below are presented applicable entity-wide disclosures related to dLocal’s revenues.
Revenue breakdown by region
The Group’s revenues arise from operations in more than twenty countries, where the merchant customers are based.
Based on the region where payments from /to such customers are processed this is the revenue breakdown:
|
|
2021 |
|
|
YoY% |
|
|
2020 |
|
|
YoY% |
|
|
2019 |
|
|||||
LatAm 1 |
|
|
223,602 |
|
|
|
140.1 |
% |
|
|
93,124 |
|
|
|
82.2 |
% |
|
|
51,103 |
|
Asia and Africa |
|
|
20,518 |
|
|
|
86.2 |
% |
|
|
11,019 |
|
|
|
163.2 |
% |
|
|
4,186 |
|
Revenues 2 |
|
|
244,120 |
|
|
|
134.4 |
% |
|
|
104,143 |
|
|
|
88.4 |
% |
|
|
55,289 |
|
Revenue with large customers
During fiscal year 2021 the Group operated with more than 420 merchants (more than 330 merchants in the year ended December 31, 2020).
For the year ended December 31, 2021, the Group’s revenue from its top 10 merchants represented 56% of revenue (64% and 70% of revenue in the years ended December 31, 2020 and 2019, respectively). In 2021 there is one customer (two in 2020 and one in 2019) that on an individual level accounted for more than 10% of the total revenue.
Adjusted EBITDA and Adjusted EBITDA Margin
The Executive Team assesses the financial performance of the Group’s sole segment by Revenues, Adjusted EBITDA and Adjusted EBITDA Margin. The Adjusted EBITDA is defined as the consolidated profit from operations before financing and taxation for the year or period, as applicable, before depreciation of property, plant and equipment, amortization of right-of-use assets and intangible assets, and further excluding the changes in fair value of financial assets and derivative financial instruments carried at fair value through profit or loss, impairment gain/loss on financial assets, transaction costs, share-based payment non-cash charges, secondary offering expenses and inflation adjustment. The Group defines Adjusted EBITDA Margin as the Adjusted EBITDA divided by consolidated revenues.
The Group reconciles the segment’s performance measure to profit for the year as presented in the Consolidated Statement of Comprehensive Income as follows:
26
|
|
Note |
December 31, |
|
|
|
December 31, |
|
|
December 31, |
|
|||
Profit for the year |
|
|
|
77,853 |
|
|
|
|
28,187 |
|
|
|
15,602 |
|
Income tax expense |
|
12 |
|
7,647 |
|
|
|
|
3,231 |
|
|
|
2,221 |
|
Inflation adjustment |
|
11 |
|
334 |
|
|
|
|
(38 |
) |
|
|
(10 |
) |
Interest charges on leases |
|
11 |
|
142 |
|
|
|
|
20 |
|
|
|
30 |
|
Interest income from financial assets at FVPL |
|
11 |
|
(2,556 |
) |
|
|
|
(443 |
) |
|
|
(217 |
) |
Fair value losses / (gains) on financial assets at FVPL |
|
11 |
|
16 |
|
|
|
|
(9 |
) |
|
|
(56 |
) |
Other operating (gain) / loss |
|
24 |
|
(2,896 |
) |
|
|
|
2,896 |
|
|
|
— |
|
Other finance expense |
|
11 |
|
402 |
|
|
|
|
(3 |
) |
|
|
(6 |
) |
Impairment loss / (gain) on financial assets |
|
16 |
|
33 |
|
|
|
|
(808 |
) |
|
|
807 |
|
Depreciation and amortization |
|
10 |
|
4,747 |
|
|
|
|
992 |
|
|
|
409 |
|
Secondary offering expenses (i) |
|
8 |
|
5,158 |
|
|
|
|
453 |
|
|
|
574 |
|
Transaction costs (ii) |
|
8 |
|
687 |
|
|
|
|
158 |
|
|
|
— |
|
Share-based payment non-cash charges, net of forfeitures |
|
13 |
|
7,590 |
|
|
|
|
7,295 |
|
|
|
716 |
|
Adjusted EBITDA |
|
|
|
99,157 |
|
|
|
|
41,931 |
|
|
|
20,070 |
|
|
|
|
|
|
|
|
|
|
|
|
|
|||
Revenues |
|
6 |
|
244,120 |
|
|
|
|
104,143 |
|
|
|
55,289 |
|
Adjusted EBITDA |
|
|
|
99,157 |
|
|
|
|
41,931 |
|
|
|
20,070 |
|
Adjusted EBITDA Margin |
|
|
|
40.6 |
% |
|
|
|
40.3 |
% |
|
|
36.3 |
% |
dLocal derives revenue from processing payments for international merchants to enable them to operate in selected emerging markets.
The breakdown of revenue from contracts with customers per type of service is as follows:
|
|
2021 |
|
|
2020 |
|
|
2019 |
|
|||
Transaction revenues (i) |
|
|
234,417 |
|
|
|
98,490 |
|
|
|
52,048 |
|
Other revenues (ii) |
|
|
9,703 |
|
|
|
5,653 |
|
|
|
3,241 |
|
Revenues from payment processing (iii) |
|
|
244,120 |
|
|
|
104,143 |
|
|
|
55,289 |
|
Cost of services |
|
|
(113,677 |
) |
|
|
(44,065 |
) |
|
|
(19,413 |
) |
Gross profit |
|
|
130,443 |
|
|
|
60,078 |
|
|
|
35,876 |
|
Transaction revenues are recognized at a point in time when the payment transaction is processed. Other revenues are recognized as revenue at a point in time when the respective performance obligation is satisfied. The Group did not recognize revenues over time during 2021, 2020 and 2019.
27
Cost of services are composed of the following:
|
|
2021 |
|
|
2020 |
|
|
2019 |
|
|||
Processing costs (i) |
|
|
107,276 |
|
|
|
41,655 |
|
|
|
18,346 |
|
Hosting expenses (ii) |
|
|
3,351 |
|
|
|
1,257 |
|
|
|
696 |
|
Salaries and wages (iii) |
|
|
706 |
|
|
|
497 |
|
|
|
196 |
|
Amortization of intangible assets (iv) |
|
|
2,344 |
|
|
|
656 |
|
|
|
175 |
|
Cost of services |
|
|
113,677 |
|
|
|
44,065 |
|
|
|
19,413 |
|
Technology and development expenses are composed of the following:
|
|
2021 |
|
|
2020 |
|
|
2019 |
|
|||
Salaries and wages (i) |
|
|
1,381 |
|
|
|
1,072 |
|
|
|
596 |
|
Software licenses (ii) |
|
|
487 |
|
|
|
292 |
|
|
|
286 |
|
Infrastructure expenses (iii) |
|
|
792 |
|
|
|
298 |
|
|
|
207 |
|
Information and technology security expenses (iv) |
|
|
176 |
|
|
|
161 |
|
|
|
145 |
|
Other technology expenses |
|
|
550 |
|
|
|
182 |
|
|
|
113 |
|
Total Technology and development expenses |
|
|
3,386 |
|
|
|
2,005 |
|
|
|
1,347 |
|
Sales and marketing expenses and General and administrative expenses are composed of the following:
Sales and marketing expenses |
|
2021 |
|
|
2020 |
|
|
2019 |
|
|||
Salaries and wages (i) |
|
|
5,126 |
|
|
|
2,518 |
|
|
|
1,554 |
|
Marketing expenses (ii) |
|
|
790 |
|
|
|
334 |
|
|
|
503 |
|
Total Sales and marketing expenses |
|
|
5,916 |
|
|
|
2,852 |
|
|
|
2,057 |
|
|
|
|
|
|
|
|
|
|
|
|||
General and administrative expenses |
|
2021 |
|
|
2020 |
|
|
2019 |
|
|||
Salaries and wages (iii) |
|
|
20,827 |
|
|
|
14,009 |
|
|
|
6,759 |
|
Third-party services (iv) |
|
|
12,632 |
|
|
|
3,615 |
|
|
|
1,823 |
|
Office expenses (v) |
|
|
2,445 |
|
|
|
1,325 |
|
|
|
2,409 |
|
Travel and other operating expenses |
|
|
2,330 |
|
|
|
2,903 |
|
|
|
2,875 |
|
Amortization and depreciation (vi) |
|
|
2,403 |
|
|
|
336 |
|
|
|
235 |
|
Total General and administrative expenses |
|
|
40,637 |
|
|
|
22,188 |
|
|
|
14,101 |
|
28
As at December 31, 2021 the Group ‘s fulltime equivalents (FTE’s) were 539 (310 in the year ended December 31, 2020) where 38% corresponded to information technology engineers (38% and 39% in the year ended December 31, 2020 and 2019, respectively).
Employee benefits is composed of the following:
|
|
2021 |
|
|
2020 |
|
|
2019 |
|
|||
Salaries, wages and contractor fees (i) |
|
|
27,535 |
|
|
|
13,785 |
|
|
|
9,884 |
|
Share-based payments (ii) |
|
|
7,590 |
|
|
|
7,295 |
|
|
|
716 |
|
Total employee benefits |
|
|
35,125 |
|
|
|
21,080 |
|
|
|
10,600 |
|
Amortization and depreciation expenses are composed of the following:
|
|
2021 |
|
|
2020 |
|
|
2019 |
|
|||
Amortization of intangible assets |
|
|
3,917 |
|
|
|
656 |
|
|
|
175 |
|
Right-of-use asset amortization |
|
|
453 |
|
|
|
181 |
|
|
|
181 |
|
Depreciation of Property, plant & equipment |
|
|
377 |
|
|
|
155 |
|
|
|
53 |
|
Total Amortization and Depreciation |
|
|
4,747 |
|
|
|
992 |
|
|
|
409 |
|
For further information related to depreciation of Property, plant and equipment refer to Note 18: Property, Plant and Equipment related to amortization of right-of-use assets refer to Note 19: Leases and related to amortization of intangible assets refer to Note 20: Intangible Assets.
29
Other results is composed of the following categories:
|
|
2021 |
|
|
2020 |
|
|
2019 |
|
|||
Interest Income from Financial Instruments (i) |
|
|
2,556 |
|
|
|
443 |
|
|
|
217 |
|
Fair value gains of financial assets at FVPL (i) |
|
|
(16 |
) |
|
|
9 |
|
|
|
56 |
|
Other finance income (ii) |
|
|
- |
|
|
|
50 |
|
|
|
6 |
|
Finance income |
|
|
2,540 |
|
|
|
502 |
|
|
|
279 |
|
|
|
|
|
|
|
|
|
|
|
|||
|
|
2021 |
|
|
2020 |
|
|
2019 |
|
|||
Interest charges for lease liabilities (iii) |
|
|
(142 |
) |
|
|
(20 |
) |
|
|
(30 |
) |
Other finance expenses |
|
|
(402 |
) |
|
|
(47 |
) |
|
|
— |
|
Finance costs |
|
|
(544 |
) |
|
|
(67 |
) |
|
|
(30 |
) |
Inflation adjustment (iv) |
|
|
(334 |
) |
|
|
38 |
|
|
|
10 |
|
Other results |
|
|
1,662 |
|
|
|
473 |
|
|
|
259 |
|
The charge for current taxation is calculated at the following income tax rates on the taxable profit for the year for the various countries in which the Group operates:
Malta |
|
|
5 |
% |
(a) |
|
Israel |
|
|
23 |
% |
|
Cayman |
|
|
0 |
% |
|
|
Mexico |
|
|
30 |
% |
|
United Kingdom |
|
|
0 |
% |
(b) |
|
India |
|
|
25 |
% |
|
Brazil |
|
|
34 |
% |
(c) |
|
Chile |
|
27% and 10% |
|
(e) |
|
Colombia |
|
|
31 |
% |
|
|
Peru |
|
|
30 |
% |
|
Argentina |
|
25% and 35% |
|
(d) |
|
Morocco |
|
|
31 |
% |
(f) |
|
Ecuador |
|
|
2 |
% |
|
|
Egypt |
|
|
23 |
% |
|
Uruguay |
|
|
25 |
% |
|
|
Southafrica |
|
|
28 |
% |
|
Panamá |
|
|
25 |
% |
|
|
Nigeria |
|
|
0 |
% |
|
Paraguay |
|
|
10 |
% |
|
|
Indonesia |
|
|
22 |
% |
|
Dominican Republic |
|
|
27 |
% |
|
|
|
|
|
|
|
|
(a) With effect from year of assessment 2020, Dlocal Group Limited made an election in order for itself and its ‘Qualifying subsidiary’ to form a fiscal unit. The total chargeable income of the fiscal unit, resulting in a flat modified corporate tax rate of 5% being applicable directly to the income allocated to the principal taxpayer.
(b) The UK partnership are tax transparent. No charge for current taxation has been made in the other subsidiaries.
(c) Composed of IRPJ (Imposto de Renda de Pessoa Juridica) at the rate of 25% and CSLL (Contribuiyao Social sobre o Lucro Liquido) at the rate of 9%.
(d) Progressive rates: 25% and 35% depending on the tax result.
(e) General tax rate: 27%. Specific rate applicable to Propyme 10%.
(f) Progressive rates: 10%, 20% and 30% depending on the tax result.
30
The income tax charge recognized in profit and losses is the following:
Current Income Tax |
|
2021 |
|
|
2020 |
|
|
2019 |
|
|||
Current Income Tax on profits for the year |
|
|
(6,940 |
) |
|
|
(3,172 |
) |
|
|
(2,237 |
) |
Total Current Income Tax expense |
|
|
(6,940 |
) |
|
|
(3,172 |
) |
|
|
(2,237 |
) |
|
|
|
|
|
|
|
|
|
|
|||
Deferred income tax |
|
2021 |
|
|
2020 |
|
|
2019 |
|
|||
Increase in deferred income tax assets |
|
|
(83 |
) |
|
|
200 |
|
|
|
16 |
|
Increase in deferred income tax liabilities |
|
|
(624 |
) |
|
|
(259 |
) |
|
|
— |
|
Total Deferred income tax (expense) / benefit |
|
|
(707 |
) |
|
|
(59 |
) |
|
|
16 |
|
Income Tax expense |
|
|
(7,647 |
) |
|
|
(3,231 |
) |
|
|
(2,221 |
) |
Deferred Tax Assets
The balance comprises temporary differences attributable to:
|
|
2021 |
|
|
2020 |
|
|
2019 |
|
|||
Tax Losses |
|
|
31 |
|
|
|
98 |
|
|
|
— |
|
Accrued Liabilities |
|
|
318 |
|
|
|
79 |
|
|
|
7 |
|
Exchange differences |
|
|
— |
|
|
|
14 |
|
|
|
9 |
|
Other |
|
|
24 |
|
|
|
25 |
|
|
|
— |
|
Total |
|
|
373 |
|
|
|
216 |
|
|
|
16 |
|
Tax losses carry-forwards have a maximum expiration of 4 years.
Movements:
|
|
Tax losses |
|
|
Accrued liabilities |
|
|
Exchange differences |
|
|
Other |
|
|
Total |
|
|||||
At January 1, 2021 |
|
|
98 |
|
|
|
79 |
|
|
|
14 |
|
|
|
25 |
|
|
|
216 |
|
(Charged) / credited to profit & loss |
|
|
(67 |
) |
|
|
237 |
|
|
|
(14 |
) |
|
|
1 |
|
|
|
157 |
|
At December 31, 2021 |
|
|
31 |
|
|
|
316 |
|
|
|
— |
|
|
|
26 |
|
|
|
373 |
|
|
|
|
|
|
|
|
|
|
|
|
|
|
|
|
|
|||||
|
|
Tax losses |
|
|
Accrued liabilities |
|
|
Exchange differences |
|
|
Other |
|
|
Total |
|
|||||
At January 1, 2020 |
|
|
— |
|
|
|
12 |
|
|
|
4 |
|
|
|
— |
|
|
|
16 |
|
(Charged) / credited to profit & loss |
|
|
98 |
|
|
|
67 |
|
|
|
10 |
|
|
|
25 |
|
|
|
200 |
|
At December 31, 2020 |
|
|
98 |
|
|
|
79 |
|
|
|
14 |
|
|
|
25 |
|
|
|
216 |
|
Deferred Tax Liabilities
The balance comprises temporary differences attributable to:
|
|
2021 |
|
|
2020 |
|
|
2019 |
|
|||
Accrued receivables |
|
|
900 |
|
|
|
259 |
|
|
|
— |
|
Other |
|
|
223 |
|
|
|
— |
|
|
|
|
|
Total |
|
|
1,123 |
|
|
|
259 |
|
|
|
— |
|
31
Movements:
|
|
Accrued |
|
|
Other |
|
|
Total |
|
|||
At January 1, 2021 |
|
|
259 |
|
|
|
— |
|
|
|
259 |
|
(charged) / credited to profit & loss |
|
|
641 |
|
|
|
223 |
|
|
|
864 |
|
At December 31, 2021 |
|
|
900 |
|
|
|
223 |
|
|
|
1,123 |
|
|
|
|
|
|
|
|
|
|
|
|||
At January 1, 2020 |
|
|
— |
|
|
|
— |
|
|
|
— |
|
(charged) / credited to profit & loss |
|
|
259 |
|
|
|
— |
|
|
|
259 |
|
At December 31, 2020 |
|
|
259 |
|
|
|
— |
|
|
|
259 |
|
As of December 31, 2021 and 2020, no deferred tax liability has been recognized on investments in subsidiaries. The Company has concluded it has the ability and intention to control the timing of any distribution from its subsidiaries and it is probable that will be no reversal in the foreseeable future in a way that would result in a charge to taxable profit
Reconciliation of effective tax rate
The effective Income Tax rate of dLocal for fiscal year 2021 was 8.9% (10.3% and 12.5% in the years ended December 31, 2020 and 2019, respectively). For fiscal year 2021, dLocal applied for fiscal consolidation in Malta resulting in a domestic rate of 5% (fiscal consolidation was not applied for 2020 and 2019, resulting in a domestic rate of 35% with a 30% of tax refund). The reconciliation between the effective Income Tax rate and the statutory rate in Malta of 5% for fiscal year 2021, and 35% for fiscal years 2020 and 2019 is as follows:
|
|
2021 |
|
|
2020 |
|
|
2019 |
|
|||
Profit before Income Tax |
|
|
85,500 |
|
|
|
31,418 |
|
|
|
17,823 |
|
Tax at the domestic rates applicable to profit before income tax in the |
|
|
(4,275 |
) |
|
|
(4,718 |
) |
|
|
(1,246 |
) |
Permanent differences: |
|
|
|
|
|
|
|
|
|
|||
Tax effect of non-taxable income |
|
|
3,369 |
|
|
|
8,489 |
|
|
|
2,929 |
|
Tax effect on income tax refund on dividends |
|
|
— |
|
|
|
(2,197 |
) |
|
|
(1,747 |
) |
Effect from entities taxes in different rates |
|
|
(3,127 |
) |
|
|
(4,254 |
) |
|
|
(2,321 |
) |
Other permanent differences |
|
|
(3,614 |
) |
|
|
(551 |
) |
|
|
164 |
|
Total Income Tax Expense |
|
|
(7,647 |
) |
|
|
(3,231 |
) |
|
|
(2,221 |
) |
32
(1) Other permanent differences for 2021 comprises taxable income from subsidiaries not included in the Profit before Income Tax for an amount of USD 1,357, non-allowable taxes for USD 921, non-allowable expenses for USD 678 and other differences for USD 658.
Authorized shares, as well as issued and fully paid up shares, are presented below:
|
|
2021 |
|
|
2020 |
|
||||||||||||
|
|
Amount |
|
|
USD |
|
|
Amount |
|
|
|
USD |
|
|||||
Authorized Shares of USD 0.002 USD each |
|
|
|
|
|
|
|
|
|
|
|
|
|
|||||
Class A common shares |
|
|
1,000,000,000 |
|
|
|
2,000 |
|
|
|
— |
|
|
— |
|
|
— |
|
Class B common shares |
|
|
250,000,000 |
|
|
|
500 |
|
|
|
— |
|
|
|
|
— |
|
|
Undesignated shares |
|
|
250,000,000 |
|
|
|
500 |
|
|
|
— |
|
|
— |
|
|
— |
|
Authorized Shares of USD 1.1211 USD each ** |
|
|
|
|
|
|
|
|
|
|
|
|
|
|||||
Common shares |
|
|
— |
|
|
|
— |
|
|
|
618,363 |
|
|
|
|
693 |
|
|
|
|
|
1,500,000,000 |
|
|
|
3,000 |
|
|
|
618,363 |
|
|
|
|
693 |
|
|
Issued and Fully Paid Up Shares of USD 0.002 each * |
|
|
|
|
|
|
|
|
|
|
|
|
|
|||||
Class A Common Shares |
|
|
149,065,490 |
|
|
|
298 |
|
|
|
268,598,000 |
|
|
|
|
602 |
|
|
Class B Common Shares |
|
|
145,962,951 |
|
|
|
292 |
|
|
|
— |
|
|
|
|
0 |
|
|
|
|
|
295,028,441 |
|
|
|
590 |
|
|
|
268,598,000 |
|
|
|
|
602 |
|
|
Share Capital evolution |
|
|
|
|
|
|
|
|
|
|
|
|
|
|||||
Share Capital as at January 1 |
|
|
268,598,000 |
|
|
|
602 |
|
|
|
268,598,000 |
|
|
|
|
602 |
|
|
i) Issue of common shares at USD 1.1211 |
|
|
19,906,000 |
|
|
|
45 |
|
|
|
— |
|
|
|
|
— |
|
|
ii) Par value change |
|
|
— |
|
|
|
(70 |
) |
|
|
— |
|
|
|
|
— |
|
|
iii) Issue of common shares at the IPO |
|
|
4,411,765 |
|
|
|
9 |
|
|
|
— |
|
|
|
|
— |
|
|
iv) Warrant excercise |
|
|
2,112,676 |
|
|
|
4 |
|
|
|
— |
|
|
|
|
— |
|
|
Share capital as of December 31 |
|
|
295,028,441 |
|
|
|
590 |
|
|
|
268,598,000 |
|
|
|
|
602 |
|
|
* Retroactively adjusted to reflect the stock split (Note 1).
** Amounts do not reflect the effect of the stock split explained in Note1.
The rights of the holders of Class A Common Shares and Class B Common Shares are identical, except with respect to voting, conversion and transfer restrictions applicable to the Class B Common Shares. Each Class A Common Share is entitled to one vote while Class B Common Shares are entitled to five votes each. Each Class B Common Share is convertible into one Class A Common Share automatically upon transfer, subject to certain exceptions. Holders of Class A Common Shares and Class B Common Shares vote together as a single class on all matters unless otherwise required by law.
|
i) |
For the year-ended December 31, 2021 and prior to the IPO date (June 3, 2021) dLocal issued 19,906,000 new Class A Common Shares receiving total proceeds of USD 63,177, according to the following details: i) 15,640,000 shares related to the exercise of share-options where dLocal received payments for USD 31,678; ii) 45,000 shares related to the exercise of share-options where dLocal received payments for USD 98; and iii) 4,221,000 shares, issued on March 3rd, 2021, where dLocal received payments for USD 31,401. |
ii) |
On April 14, 2021 existing shareholders of dLocal Group Limited contributed the outstanding shares, with par value of 1.1211 U.S. Dollars, to dLocal, and received the same number of shares with par value of 1 U.S. Dollars. |
iii) |
On June 3, 2021 the following transactions took place related to the Group’s IPO: i) the Group made a 500-for-1 share split where the shareholders of dLocal exchanged 577,008 shares with par value of 1 U.S. Dollars for 288,504,000 shares of par value 0.002 U.S. Dollars of the same entity; ii) 4,411,765 shares were issued as part of the initial public offering where dLocal received a payment, net of issuance costs, of USD 86,450 based on a market price of 21.0 U.S. Dollars per share. |
iv) |
On September 2, 2021 a holder of warrants exercised its net issuance right resulting in a net issuance on September 7, 2021 of 2,112,676 shares at a Fair Market Value of U.S. Dollars 65.14 per share, calculated using the average price of 5 business days before the exercise date. |
33
The Capital reserve corresponds to reserves related to the share-based plans, as described in Note 2.11: Share-based payments and warrants.
This reserve is related to share-based payment compensation plans of the Group.
The following table shows a breakdown of the consolidated statement of financial position line item ‘Capital Reserves’ and the movements in these reserves during the year:
|
|
2021 |
|
|
2020 |
|
|
2019 |
|
|||
Balances as of January 1 |
|
|
12,582 |
|
|
|
5,287 |
|
|
|
238 |
|
Share-options exercise (i) |
|
|
(6,898 |
) |
|
|
— |
|
|
|
— |
|
Share-based payments charges |
|
|
7,596 |
|
|
|
7,295 |
|
|
|
5,049 |
|
Forefeitures |
|
|
(6 |
) |
|
|
— |
|
|
|
— |
|
Warrant exercise |
|
|
(533 |
) |
|
|
— |
|
|
|
— |
|
Balance as at December 31, 2021 |
|
|
12,741 |
|
|
|
12,582 |
|
|
|
5,287 |
|
(i) During the year-ended December 31, 2021 a total of 15,685,000 share-options under the share-based payments plan were exercised. Consequently, the correspondent charge to Capital reserve was recycled into the Share premium line item within equity.
The Other Reserves for the Group relate to cumulative translation adjustment representing differences on conversion of assets and liabilities at the reporting date.
The following table shows a breakdown of the consolidated statement of financial position line item ‘Reserves’ and the movements in these reserves during the year:
|
|
2021 |
|
|
2020 |
|
|
2019 |
|
|||
|
|
Cumulative Translation Adjustment |
|
|
Cumulative Translation Adjustment |
|
|
Cumulative Translation Adjustment |
|
|||
Balances as of January 1 |
|
|
119 |
|
|
|
14 |
|
|
|
(13 |
) |
Movement of other reserves |
|
|
(149 |
) |
|
|
105 |
|
|
|
27 |
|
Balance as at December 31, 2021 |
|
|
(30 |
) |
|
|
119 |
|
|
|
14 |
|
Movements in retained earnings were as follows:
Balance as at January 1, 2019 |
|
|
12,858 |
|
Comprehensive income for the year |
|
|
15,602 |
|
Distribution of retained earnings |
|
|
(10,000 |
) |
Balance as at December 31, 2019 |
|
|
18,460 |
|
Comprehensive income for the year |
|
|
28,126 |
|
Transaction between shareholders |
|
|
163 |
|
Distribution of retained earnings |
|
|
(15,000 |
) |
Balance as at December 31, 2020 |
|
|
31,749 |
|
Comprehensive income for the year |
|
|
78,118 |
|
Balance as at December 31, 2021 |
|
|
109,867 |
|
dLocal calculates basic and diluted earnings per share as stated in Note 2.13: Equity.
34
The next table presents the information used as base for such calculation:
|
|
2021 |
|
|
2020 |
|
|
2019 |
|
|||
Profit attributable to common shareholders (U.S. Dollars) |
|
|
77,852,950 |
|
|
|
28,186,840 |
|
|
|
15,602,193 |
|
Weighted average number of common shares |
|
|
287,121,304 |
|
|
|
268,598,000 |
|
|
|
266,386,541 |
|
Adjustments for calculation of diluted earnings per share(1) |
|
|
21,809,000 |
|
|
|
16,242,000 |
|
|
|
9,059,531 |
|
Weighted average number of common shares for calculating diluted earnings per share |
|
|
308,930,304 |
|
|
|
284,840,000 |
|
|
|
275,446,073 |
|
Basic earnings per share |
|
|
0.27 |
|
|
|
0.10 |
|
|
|
0.06 |
|
Diluted earnings per share |
|
|
0.25 |
|
|
|
0.10 |
|
|
|
0.05 |
|
Cash and cash equivalents breakdown is presented below:
|
|
2021 |
|
|
2020 |
|
||
Own Balances |
|
|
227,913 |
|
|
|
43,684 |
|
Merchant Clients Funds |
|
|
108,284 |
|
|
|
68,049 |
|
|
|
|
336,197 |
|
|
|
111,733 |
|
As at December 31, 2021, USD 336,197 (USD 111,733 on December 31, 2020) represents cash on hand, demand deposits with financial institutions and other short -term liquid financial instruments.
Own Balances corresponds to cash and cash equivalents of the Group while Merchant Clients Funds corresponds to freely available funds collected from the merchant customers, that can be invested in secure, liquid low-risk assets until they are transferred to the merchants in accordance with the agreed conditions with them.
Financial assets include the following:
|
|
2021 |
|
|
2020 |
|
||
Debt instruments |
|
|
1,004 |
|
|
|
8,319 |
|
|
|
|
1,004 |
|
|
|
8,319 |
|
For 2021 and 2020, Debt instruments are investments in quoted debt securities.
For further information referred to accounting policies see Note 2.5 Financial instruments-initial recognition and subsequent measurement and related to fair value hierarchies see Note 31: Fair value hierarchy.
During the year, the following gains/(losses) were recognized in profit or loss:
|
|
2021 |
|
|
2020 |
|
||
Fair Value Movement transferred to profit and loss |
|
|
16 |
|
|
|
9 |
|
At End of Year |
|
|
16 |
|
|
|
9 |
|
Information about the Group’s exposure to price risk is provided in Note 29: Financial risk management.
35
Trade and Other Receivables of the Group are composed of the following:
|
|
2021 |
|
|
2020 |
|
||
Trade receivables |
|
|
179,199 |
|
|
|
67,553 |
|
Loss allowance |
|
|
(322 |
) |
|
|
(341 |
) |
Trade receivables net |
|
|
178,877 |
|
|
|
67,212 |
|
Advances and other receivables |
|
|
12,089 |
|
|
|
5,573 |
|
|
|
|
190,966 |
|
|
|
72,785 |
|
Trade Receivables correspond to uncollateralized gross amounts due from acquirers, processors, merchants and preferred suppliers for services performed that will be collected in less than one year, so they are classified as current. No financial assets are past due except for some trade receivables. All Trade and other receivables are categorized in “normal” credit risk rating ("normal" credit risk rating comprises financial assets to which significant increase in credit risk has not occured since initial recognition).
Loss allowance and impairment losses
The following table presents the evolution of the loss allowance:
|
|
2021 |
|
|
2020 |
|
||
Opening book value as at January 1 |
|
|
(341 |
) |
|
|
(807 |
) |
Increase in loss allowance for trade receivables |
|
|
(33 |
) |
|
|
(232 |
) |
Reversals for decrease in loss rate |
|
|
52 |
|
|
|
698 |
|
Total as at December 31 |
|
|
(322 |
) |
|
|
(341 |
) |
Net impairment (loss)/gain on financial assets(i) |
|
|
(33 |
) |
|
|
808 |
|
As disclosed in Note 2.5 Financial instruments-initial recognition and subsequent measurement, the Group applies the simplified approach to determine expected credit losses on trade receivables.
To measure the expected credit losses, trade and other receivables have been grouped based on shared credit risk characteristics and the days past due (only 0-30 past due bucket as of December 31st, 2021 and 2020 because there are no other material buckets of the outstanding receivables).
The expected loss rates are based on the payment profiles of debtors over a period of 36 months before year end and the corresponding historical credit losses experienced within this period. The historical loss rate is adjusted to reflect current and forward-looking information on credit risk ratings of the countries in which the Group sells its services which affects the ability of the debtors to settle the receivables. On that basis, the expected credit loss rate of the 0-30 past due bucket was determined at 0.4% (0.5% in the year ended December 31, 2020).
For further information refer to Note 30: Financial risk management - Impairment of financial assets.
Advances and other receivables include payments made in advance as well as tax credits.
36
Other assets are composed of the following:
Current |
|
2021 |
|
|
2020 |
|
||
Money held in escrow for: (i) |
|
|
211 |
|
|
|
1,070 |
|
-Payment Processing Service Agreements |
|
|
— |
|
|
|
859 |
|
-Requirements for other processors |
|
|
80 |
|
|
|
80 |
|
-Credit card requirements |
|
|
131 |
|
|
|
131 |
|
Rental guarantees |
|
|
561 |
|
|
|
95 |
|
Capitalized transaction costs (ii) |
|
|
— |
|
|
|
302 |
|
Prepaid assets (iii) |
|
|
567 |
|
|
|
550 |
|
Total current Other Assets |
|
|
1,339 |
|
|
|
2,017 |
|
|
|
|
|
|
|
|
||
Non-current |
|
|
|
|
|
|
||
Prepaid assets (iii) |
|
|
— |
|
|
|
143 |
|
Total non-current Other Assets |
|
|
— |
|
|
|
143 |
|
Property, Plant and Equipment of the Group correspond to computer equipment that is stated at cost less accumulated depreciation.
|
|
2021 |
|
|
2020 |
|
||||||||||||||
|
|
Computer |
|
|
Building improvements |
|
|
Work in |
|
|
Total |
|
|
Computer |
|
|||||
Cost |
|
|
645 |
|
|
|
— |
|
|
|
486 |
|
|
|
1,131 |
|
|
|
255 |
|
Accumulated depreciation |
|
|
(218 |
) |
|
|
— |
|
|
|
— |
|
|
|
(218 |
) |
|
|
(63 |
) |
Opening book value, January 1 |
|
|
427 |
|
|
|
— |
|
|
|
486 |
|
|
|
913 |
|
|
|
192 |
|
Additions |
|
|
1,178 |
|
|
|
— |
|
|
|
771 |
|
|
|
1,949 |
|
|
|
876 |
|
Transfers |
|
|
— |
|
|
|
1,257 |
|
|
|
(1,257 |
) |
|
|
— |
|
|
|
— |
|
Depreciation of the year |
|
|
(335 |
) |
|
|
(42 |
) |
|
|
— |
|
|
|
(377 |
) |
|
|
(155 |
) |
Total as at December 31 |
|
|
1,270 |
|
|
|
1,215 |
|
|
|
— |
|
|
|
2,485 |
|
|
|
913 |
|
Cost |
|
|
1,823 |
|
|
|
1,257 |
|
|
|
— |
|
|
|
3,080 |
|
|
|
1,131 |
|
Accumulated depreciation |
|
|
(553 |
) |
|
|
(42 |
) |
|
|
— |
|
|
|
(595 |
) |
|
|
(218 |
) |
Work in progress comprises costs related to design and offices construction costs, such as professional fees of architects and construction suppliers as well as costs of building materials, related to a new lease with a commencement date on September 1, 2021. Such costs were not contingent on obtaining the lease, did not influence the lease contract negotiation and therefore did not qualify as initial direct cost to be included in the right-of-use asset initial measurement. Accordingly, these costs were recognized as “Work in progress” and were transferred to Property, plant and equipment line item called “Building improvements”. These assets are amortized using the straight-line method, over the shorter of the estimated useful life of the asset or the remaining term of the lease.
The Group did not recognize losses from impairment of Property, Plant and Equipment during 2021 and 2020, nor reversed any impairment losses. Moreover, dLocal did not have any commitments to purchase any property, plant and equipment at year end.
For further details on accounting policies refer to Note 2.7: Property, plant and equipment.
37
This Note provides information for leases in which the Group is a lessee.
The Group’s leases contracts refer to the use of explicitly defined office facilities in different countries, where it obtains substantially all of the economic benefits and has the right to direct the use of such offices.
|
|
2021 |
|
|
2020 |
|
||
Right-of-use assets |
|
|
|
|
|
|
||
Offices |
|
|
3,915 |
|
|
|
188 |
|
|
|
|
3,915 |
|
|
|
188 |
|
|
|
|
|
|
|
|
||
|
|
2021 |
|
|
2020 |
|
||
Lease liabilities |
|
|
|
|
|
|
||
Current |
|
|
502 |
|
|
|
201 |
|
Non-current |
|
|
3,426 |
|
|
|
17 |
|
|
|
|
3,928 |
|
|
|
218 |
|
The Group has no additions to the right-of-use assets during 2020, and during 2021 the additions totalized USD 3,727.
The Consolidated Statements of Comprehensive Income shows the following amounts relating to leases:
|
|
2021 |
|
|
2020 |
|
||
Amortization of right-of-use assets |
|
|
|
|
|
|
||
Offices |
|
|
453 |
|
|
|
181 |
|
|
|
|
453 |
|
|
|
181 |
|
Interest charges for lease liabilities (included within Finance Cost line |
|
|
142 |
|
|
|
20 |
|
Leases expense for short-term leases (included within General and |
|
|
173 |
|
|
|
174 |
|
The total cash outflow for leases during 2021 was USD 430 (USD 355 in 2020).
Short-term Leases
The Group has signed leases contracts of one year or less in the following countries: Malta, Israel, Uruguay, Brazil, China, Chile and Argentina.
In those locations, except for Uruguay, the Group uses co-works facilities and seeks to sign short-tenn contracts as a general practice, in order to have flexibility to increase, reduce or terminate leases based on the Group’s operations and plans. The type of facilities used represent low levels of costs to change locations and no relevant modifications or constructions are made to these leased facilities.
In all these markets there are available suitable alternatives since the offices do not require special infrastructure and there are low costs of returning the assets.
Management reviews at the end of each term the need to extend the leasing or not, based on activities undertaken by the Dlocal entity, market trends (economic and health) as well as strategic plans for each country.
For the application of IFRS 16 Leases the Group applies a practical expedient to account for leases for which the lease term ends within 12 months of the date of initial application as short-term leases. For these leases, in subsequent reporting periods, the Group applies the short-tenn exception established in IFRS 16 Leases. Consequently, it recognizes the related lease payments as an expense on a straight-line basis over the lease tenn.
38
Long-term Leases
dLocal Technologies SA (Uruguay) signed on February 15, 2018 a 4-year contract to lease Unit 507 (347,99 m2) of WTC Free Zone in Uruguay.
This contract establishes the following payments structure (all amounts in thousands):
The term of 4 years can be extended for periods of 5 years, unless any of the parties informs the other of its decision to terminate with at least 120 days anticipation of the expiry date.
The incremental borrowing rate, used to discount payments to be made after January 1st, 2019, was estimated in 6.52% (in USD). Since Dlocal did not have loans to consider its costs as a reference such rate was estimated as the rate that dLocal would have had to pay to borrow over a similar tenn, and with a similar security, the funds necessary to obtain an asset of a similar value to the right-of-use asset in a similar economic environment.
Related to this contract between dLocal Technologies S.A. and WTC Free Zone S.A. for the use of Unit 507, as at August 11, 2020 a contract modification was signed in order to return such Unit and start using Units 1531 and 1631 of the building WTC Free Zone II, when the latter become available to dLocal.
The commencement date of this new lease occured during April, 2021. The Group incurred in costs for the design and construction of the new offices during 2020 and 2021, identified as "Work in Progress" in line "Property, Plant and Equipment".
Such costs were not contingent on obtaining the lease, did not influence the lease contract negotiation and therefore they do not qualify as initial direct cost to be included in the right-of-use asset initial measurement accounted in 2021.
For subsequent periods the treatment of leases that do not apply for the short-tenn exception is as follows:
39
Due to the effects of the COVID-19 pandemic the Group agreed with the lessor of the WTC Free Zone to have an exoneration of three-monthly installments that amounted to USD 50.
The Group has early adopted COVID-19-Related Rent Concessions – Amendment to IFRS 16 issued on 28 May 2020 by the IASB related to such benefit.
Based on such amendment the Group recognized a gain related to the exoneration of USD 50 and reduced the lease liability, maintaining the original accounting treatment for the lease.
Intangible assets of the Group correspond to capitalized expenses related to internally generated software and the intangible asset acquiered described below in this Note in section "Intangible Asset Acquisition".
The following table provides information about each class of intangible assets held by the Group as of December 31, 2021 and 2020. Intangible assets are stated at cost less accumulated amortization:
|
|
2021 |
|
|
2020 |
|
||||||||||
At January 1, 2020 |
|
Internally generated software |
|
|
Acquired intangible assets (ii) |
|
|
Total |
|
|
Internally generated software |
|
||||
Cost |
|
|
4,989 |
|
|
|
— |
|
|
|
4,989 |
|
|
|
1,983 |
|
Accumulated amortization |
|
|
(836 |
) |
|
|
— |
|
|
|
(836 |
) |
|
|
(180 |
) |
Opening book value as at January 1, 2021 |
|
|
4,153 |
|
|
|
— |
|
|
|
4,153 |
|
|
|
1,803 |
|
Additions (i) |
|
|
7,398 |
|
|
|
39,335 |
|
|
|
46,733 |
|
|
|
3,006 |
|
Amortization of the year |
|
|
(2,343 |
) |
|
|
(1,574 |
) |
|
|
(3,917 |
) |
|
|
(656 |
) |
Total as at December 31, 2021 |
|
|
9,208 |
|
|
|
37,761 |
|
|
|
46,969 |
|
|
|
4,153 |
|
Cost |
|
|
12,387 |
|
|
|
39,335 |
|
|
|
51,722 |
|
|
|
4,989 |
|
Accumulated amortization |
|
|
(3,179 |
) |
|
|
(1,574 |
) |
|
|
(4,753 |
) |
|
|
(836 |
) |
At December 31, 2021 and 2020 no indicator of impairment related to intangible assets existed, so the Group did not perform and impairment test. See Note 2. 8: Intangible assets for accounting policies relevant to intangible assets and Note 2.9: Impairment of non-financial assets for policy regarding impairments.
Intangible Asset Acquisition
40
In addition, on March 11, 2021, with effective date April 1, 2021, dLocal signed a contract to acquire certain assets from Primeiropay S.A.R.L and PrimeiroPay Technology GmbH (“Primeiropay”) in accordance with the Transfer of a Going Concern Agreement (“the Agreement”) signed between the parties, for a consideration of USD 40.0 million, of which USD 1.33 million is contingent consideration (subject to the achievement of the “earn-out”) and USD 38.67 million was an immediate cash consideration, with an effective date of April 1, 2021. According to Management’s estimates, the fair value of the contingent consideration is USD 665, and would be paid during 2022.
Primeiropay is an international payment service provider that delivers payment services for international merchants that want to accept payments from their international customers without setting up a local entity through processing all cards and payment methods domestically in local currencies. The asset acquisition is expected to increase the Group’s market share through the incorporation of new global merchants processing payments in emerging markets. Details of the purchase consideration are as follows:
Purchase consideration |
|
USD |
|
|
Cash paid |
|
|
38,670 |
|
Contingent consideration at fair value |
|
|
665 |
|
Total Purchase Consideration |
|
|
39,335 |
|
The Group applied the concentration test detailed on Paragraph B7B of IFRS 3 – Business Combinations, to assess whether the acquired set of activities and assets were or not a business. The concentration test was met since substantially all the fair value of the gross assets acquired was concentrated in a group of similar identifiable assets (i.e. intangible assets related to merchant agreements) and the intellectual property that is attached to them. Consequently, the transaction was classified as an asset acquisition, outside of the scope of IFRS 3 (Paragraph 2b).
Recognition of assets acquired
On April 1, 2021 the Group recognized the assets acquired (mainly merchant agreements) as a single intangible asset in accordance with IAS 38 – Intangible Assets. The Group estimated the amortization period for such single intangible asset to be 18.75 years.
Trade and Other Payables are composed of the following:
|
|
2021 |
|
|
2020 |
|
||
Trade Payables |
|
|
269,227 |
|
|
|
136,727 |
|
Accrued Liabilities |
|
|
3,173 |
|
|
|
2,928 |
|
Other Payables |
|
|
4,760 |
|
|
|
3,210 |
|
Total Trade and other payables |
|
|
277,160 |
|
|
|
142,865 |
|
Trade and Other Payables are classified as current liabilities as the payment is due within one year or less. Moreover, the carrying amounts are considered to be the same as fair values, due to their short – term nature.
Trade Payables correspond to liabilities with Merchants, either related to payin transactions processed or payout transactions to be processed at their request. Accrued Liabilities mainly correspond to obligations with legal and tax advisors, and auditors. Other Payables mainly correspond to obligations related to processors’ costs and the acquisitions of office goods and services necessary for the ordinary course of the business.
During the year 2021, dLocal has received borrowings from a financial institution in Brazilian Reais (BRZ) amounting to USD 5,000 (BRZ 27 million) for working capital, with expiration date on April 19, 2022 and accruing interest at an annual fixed interest rate of 1.85%. The total outstanding as of December 31, 2021 amounts to USD 5,015 and is disclosed in the line "Borrowings".
41
The tax liabilities breakdown is as follows:
|
|
2021 |
|
|
2020 |
|
||
Income tax payable |
|
|
1,940 |
|
|
|
1,910 |
|
Other tax liabilities |
|
|
11,186 |
|
|
|
5,877 |
|
Income tax perception (RG 4815) (1) |
|
|
7,490 |
|
|
|
3,343 |
|
Digital services withholding VAT |
|
|
2,796 |
|
|
|
1,579 |
|
Other Taxes |
|
|
900 |
|
|
|
955 |
|
Total Tax Liabilities |
|
|
13,126 |
|
|
|
7,787 |
|
(1) Corresponds to a perception applicable for transactions processed in Argentina.
Option to purchase common shares
As of the beginning of year-ended December 31, 2021, dLocal Limited had an option agreement in place with one shareholder (“Investor”), pursuant to which the Investor had outstanding options to purchase up to 18,068,000 common shares from certain existing shareholders, or by direct issuance of Company shares, which could be exercised by the Investor on or before December 16, 2021.
On March 3, 2021, the investor exercised the right to purchase 18,068,000 Class A Ordinary shares in dLocal Group Limited, by acquiring them from other existing shareholders, without being required the issuance of new shares by dLocal. In this sense, as of March 3, 2021 the obligations of dLocal under this agreement ceased.
Considering that as of December 31, 2020 the derivative financial instrument represented a liability for dLocal of USD 2,896, a gain for the same amount was recognized within Operating profit in the line item “Other operating gain/(loss)” in the Consolidated Statements of Comprehensive Income for the twelve-month period ended December 31, 2021.
Other derivative financial instruments
During the year-ended December 31, 2021, dLocal entered into short-term derivative contracts (delivery and non-delivery forwards) with different counterparties in different countries in which the Group operates, according to the following detail:
Transaction |
|
Type of Forward Transaction |
|
|
Local currency |
|
|
Notional amount in USD |
|
|
Fair value of transactions recognized in Income Statement during 2021 - (Loss)/Gain |
|
|
Outstanding balance as of December 31, 2021 - Derivative financial liabilities |
|
|||||
Non-delivery forwards |
|
Buy USD |
|
|
Brazilian Reais |
|
|
|
37,709,420 |
|
|
|
(220 |
) |
|
|
(152 |
) |
||
Non-delivery forwards |
|
Buy USD |
|
|
Argentinean Peso |
|
|
|
2,500,000 |
|
|
|
(125 |
) |
|
|
— |
|
||
Delivery forwards (1) |
|
Buy USD |
|
|
Chilean Peso |
|
|
|
107,483,927 |
|
|
|
40 |
|
|
|
(8 |
) |
||
Non-delivery forwards |
|
Buy USD |
|
|
Indian Rupee |
|
|
|
10,000,000 |
|
|
|
(59 |
) |
|
|
(14 |
) |
||
Non-delivery forwards |
|
Buy USD |
|
|
Southafrican Rand |
|
|
|
9,582,534 |
|
|
|
120 |
|
|
|
(47 |
) |
||
Total |
|
|
— |
|
|
|
— |
|
|
|
167,275,881 |
|
|
|
(244 |
) |
|
|
(221 |
) |
(1) dLocal entered into hedge operations of trade and other receivables in Chilean Peso subject to foreign exchange exposure using the delivery forward contracts. The transactions have been elected for hedge accounting and classified as fair value hedge in accordance with IFRS 9. During 2021, dLocal recognized a gain of USD 322 and a derivative financial liability of USD 8 derived from these hedging transactions.
.
42
Provisions for the year are related to labor potential contingencies where the management understands, based on the Group’s internal legal advisors’ assessment, that it is more likely than not that an outflow of resources will be required to settle the obligation and a reliable estimate can be made of the amount of the obligation.
Movements in Labor provisions are set out below:
Carrying amount as at January 1, 2020 |
|
|
798 |
|
Additional charge to labor provision |
|
|
595 |
|
Carrying amount as at December 31, 2020 |
|
|
1,393 |
|
Additional charge to labor provision |
|
|
317 |
|
Carrying amount as at December 31, 2021 |
|
|
1,710 |
|
The Group had no outstanding contingent assets or liabilities as at December 31, 2021 and 2020, except for the contingent consideration liability mentioned in Note 20: Intangible Assets and labor contingencies detailed in Note 25: Provisions.
As at December 31, 2021 the Group’s had cash in Banks as guarantees for USD 6,330 required by Merchants under the corresponding Payment Processing Service Agreements.
Additionally, as at December 31, 2020 the Group’s bankers had issued guarantees for USD 859 (USD 786 in the year ended December 31, 2019), required by certain Merchants under the corresponding Payment Processing Service Agreements.
Financial assets and liabilities are offset and the net amount is reported in the Consolidated Statement of Financial Position where the Group currently has a legally enforceable right to offset the recognized amounts, and there is an intention to settle on a net basis or realize the asset and settle the liability simultaneously.
43
The following table presents the recognized financial instruments that are offset as at December 31, 2021 and 2020:
|
|
Effects of offsetting on the Consolidated |
|
|||||||||
|
|
Statements of Financial Position |
|
|||||||||
|
|
|
|
|
Gross amounts |
|
|
Net amounts |
|
|||
2021 |
|
Gross amounts |
|
|
set off |
|
|
presented |
|
|||
Financial assets |
|
USD |
|
|
USD |
|
|
USD |
|
|||
Cash and cash equivalents |
|
|
336,197 |
|
|
|
— |
|
|
|
336,197 |
|
Financial assets at FVPL |
|
|
1,004 |
|
|
|
— |
|
|
|
1,004 |
|
Trade and other receivables |
|
|
196,939 |
|
|
|
(5,973 |
) |
|
|
190,966 |
|
Other assets |
|
|
1,339 |
|
|
|
— |
|
|
|
1,339 |
|
Total |
|
|
535,479 |
|
|
|
(5,973 |
) |
|
|
529,506 |
|
Financial liabilities |
|
|
|
|
|
|
|
|
|
|||
Trade and other payables |
|
|
283,133 |
|
|
|
(5,973 |
) |
|
|
277,160 |
|
Financial liabilities |
|
|
5,014 |
|
|
|
— |
|
|
|
5,014 |
|
Derivative financial instruments |
|
|
221 |
|
|
|
— |
|
|
|
221 |
|
Total |
|
|
288,368 |
|
|
|
(5,973 |
) |
|
|
282,395 |
|
|
|
|
|
|
|
|
|
|
|
|||
|
|
|
|
|
Gross amounts |
|
|
Net amounts |
|
|||
2020 |
|
Gross amounts |
|
|
set off |
|
|
presented |
|
|||
Financial assets |
|
USD |
|
|
USD |
|
|
USD |
|
|||
Cash and cash equivalents |
|
|
111,733 |
|
|
|
— |
|
|
|
111,733 |
|
Financial assets at FVPL |
|
|
8,319 |
|
|
|
— |
|
|
|
8,319 |
|
Trade and other receivables |
|
|
75,834 |
|
|
|
(3,049 |
) |
|
|
72,785 |
|
Other assets |
|
|
2,017 |
|
|
|
— |
|
|
|
2,017 |
|
Total |
|
|
197,903 |
|
|
|
(3,049 |
) |
|
|
194,854 |
|
Financial liabilities |
|
|
|
|
|
|
|
|
|
|||
Trade and other payables |
|
|
145,914 |
|
|
|
(3,049 |
) |
|
|
142,865 |
|
Derivative financial instruments |
|
|
2,896 |
|
|
|
— |
|
|
|
2,896 |
|
Total |
|
|
148,810 |
|
|
|
(3,049 |
) |
|
|
145,761 |
|
The gross amount set off presented above corresponds to trade receivables from fees that are offset from liabilities with Merchants considering that there is an enforceable legal right to offset and the Group expects to cancel such obligations on a net basis. Additionally, it should be noted that the Group does not have arrangements that do not meet the criteria for offsetting but still allow for the related amounts to be set off in the future.
Related party transactions are linked to the options agreement that is described in Note 24 of these financial statements.
The compensation of the Executive Team during the year can be breakdown as follows:
|
|
2021 |
|
|
2020 |
|
||
Short-term employee benefits – Salaries and wages |
|
|
1,900 |
|
|
|
871 |
|
Long-term employee benefits – Share-based payment |
|
|
7,590 |
|
|
|
7,180 |
|
|
|
|
9,490 |
|
|
|
8,051 |
|
The following transactions occurred with related parties:
|
|
2021 |
|
|
2020 |
|
||
Transactions with merchants – Revenues |
|
|
2,030 |
|
|
|
1,594 |
|
Transactions with preferred suppliers (Collection agents) – Costs |
|
|
(561 |
) |
|
|
(354 |
) |
Transactions with other related parties – Costs |
|
|
— |
|
|
|
(2 |
) |
44
The following balances are outstanding at the end of the reporting period in relation to transactions with related parties:
|
|
2021 |
|
|
2020 |
|
||
Transactions with merchants – accounts payable |
|
|
(622 |
) |
|
|
(598 |
) |
Transactions with preferred suppliers (Collection agents) – accounts payable |
|
|
(125 |
) |
|
|
(39 |
) |
Transactions with preferred suppliers (Collection agents) – accounts receivable |
|
|
6,058 |
|
|
|
506 |
|
All transactions with related parties were made on normal commercial terms and conditions and at market rates. Outstanding balances are unsecured and are repayable in cash.
The most significant non-cash transaction is detailed below:
|
|
2021 |
|
|
2020 |
|
|
2019 |
|
|||
Right-of-use asset recognition with an increase in Lease liabilities |
|
|
(3,915 |
) |
|
|
(188 |
) |
|
|
(370 |
) |
45
Net debt reconciliation:
This section sets out an analysis of net debt and the movements in net debt for each of the periods presented.
Net debt |
|
2021 |
|
|
2020 |
|
|
2019 |
|
|||
Cash and cash equivalents |
|
|
336,197 |
|
|
|
111,733 |
|
|
|
34,765 |
|
Financial assets at fair value through profit or loss |
|
|
1,004 |
|
|
|
8,319 |
|
|
|
15,399 |
|
Borrowings |
|
|
(5,014 |
) |
|
|
— |
|
|
|
— |
|
Lease liabilities |
|
|
(3,928 |
) |
|
|
(218 |
) |
|
|
(399 |
) |
Derivative financial instrument |
|
|
(221 |
) |
|
|
(2,896 |
) |
|
|
— |
|
Net debt |
|
|
328,038 |
|
|
|
116,938 |
|
|
|
49,765 |
|
Cash and liquid investments |
|
|
337,201 |
|
|
|
120,052 |
|
|
|
50,164 |
|
Gross debt – fixed interest rates |
|
|
(9,163 |
) |
|
|
(3,114 |
) |
|
|
(399 |
) |
Net debt |
|
|
328,038 |
|
|
|
116,938 |
|
|
|
49,765 |
|
According to the IAS 7, the movements in the debt of the year that impact on the cash flow as part of the financing activities are detailed below:
|
|
Interest |
|
|
Lease |
|
|
Derivative |
|
|
Sub-total |
|
|
Cash & Cash |
|
|
Financial Assets at FVPL |
|
|
Total |
|
|||||||
Net debt as at December 31,2018 |
|
|
(9,174 |
) |
|
|
— |
|
|
|
— |
|
|
|
(9,174 |
) |
|
|
23,305 |
|
|
|
16,690 |
|
|
|
30,821 |
|
Leases |
|
|
— |
|
|
|
(551 |
) |
|
|
— |
|
|
|
(551 |
) |
|
|
— |
|
|
|
— |
|
|
|
(551 |
) |
Cash flows |
|
|
— |
|
|
|
182 |
|
|
|
— |
|
|
|
182 |
|
|
|
11,460 |
|
|
|
(1,818 |
) |
|
|
9,824 |
|
Debt prepaid (i) |
|
|
9,174 |
|
|
|
— |
|
|
|
— |
|
|
|
9,174 |
|
|
|
— |
|
|
|
— |
|
|
|
9,174 |
|
Other changes (ii) |
|
|
— |
|
|
|
(30 |
) |
|
|
— |
|
|
|
(30 |
) |
|
|
— |
|
|
|
527 |
|
|
|
497 |
|
Net debt as at December 31,2019 |
|
|
— |
|
|
|
(399 |
) |
|
|
— |
|
|
|
(399 |
) |
|
|
34,765 |
|
|
|
15,399 |
|
|
|
49,765 |
|
Cash flows |
|
|
— |
|
|
|
151 |
|
|
|
— |
|
|
|
151 |
|
|
|
76,968 |
|
|
|
(7,532 |
) |
|
|
69,587 |
|
Fair value changes |
|
|
— |
|
|
|
— |
|
|
|
(2,896 |
) |
|
|
(2,896 |
) |
|
|
— |
|
|
|
9 |
|
|
|
(2,887 |
) |
Lease benefit for |
|
|
|
|
|
|
|
|
|
|
|
|
|
|
|
|
|
|
|
|
|
|||||||
COVID-19 |
|
|
— |
|
|
|
50 |
|
|
|
— |
|
|
|
50 |
|
|
|
— |
|
|
|
— |
|
|
|
50 |
|
Other Changes |
|
|
— |
|
|
|
(20 |
) |
|
|
— |
|
|
|
(20 |
) |
|
|
— |
|
|
|
443 |
|
|
|
423 |
|
Net debt as at December 31,2020 |
|
|
— |
|
|
|
(218 |
) |
|
|
(2,896 |
) |
|
|
(3,114 |
) |
|
|
111,733 |
|
|
|
8,319 |
|
|
|
116,938 |
|
Cash flows |
|
|
(5,000 |
) |
|
572 |
|
|
|
— |
|
|
|
(4,428 |
) |
|
|
224,464 |
|
|
|
(10,076 |
) |
|
|
209,960 |
|
|
Fair value changes |
|
|
— |
|
|
|
— |
|
|
|
2,675 |
|
|
|
2,675 |
|
|
|
— |
|
|
|
2,761 |
|
|
|
5,436 |
|
New leases |
|
|
— |
|
|
|
(4,282 |
) |
|
|
— |
|
|
|
(4,282 |
) |
|
|
— |
|
|
|
— |
|
|
|
(4,282 |
) |
Other Changes |
|
|
(14 |
) |
|
|
— |
|
|
|
— |
|
|
|
(14 |
) |
|
|
— |
|
|
|
— |
|
|
|
(14 |
) |
Net debt as at December 31,2021 |
|
|
(5,014 |
) |
|
|
(3,928 |
) |
|
|
(221 |
) |
|
|
(9,163 |
) |
|
|
336,197 |
|
|
|
1,004 |
|
|
|
328,038 |
|
The Group’s activities may expose it to a variety of financial risks: credit risk, market risk (including foreign exchange risk, cash flow or fair value interest rate risk, and equity price risk), liquidity risk and fraud risk. The Group’s overall risk management program focuses on the unpredictability of financial markets and seeks to minimize potential adverse effects on the Group’s financial performance.
The Board of Directors (the “Board) has overall responsibility for the establishment and oversight of the Group’s risk management objectives and policies.
The Group’s risk management policies are established to identify and analyze the risks faced by the Group, to set appropriate risk limits and controls, and to monitor risks and adherence to limits. Risk management policies and systems are reviewed regularly to reflect changes in market conditions and the Group’s activities. The overall objective of the Board is to set policies that seek to reduce
46
risk as much as possible without unduly affecting the Group’s competitiveness and flexibility. Further details of these policies are set out below:
Credit risk is the risk that customer or a counterparty will not meet its obligations under a financial instrument or customer contract, leading to a financial loss. Credit risk arises from the group’s exposures to third parties, including cash and cash equivalents, financial instruments and from its operating activities, primarily related to trade and other receivables.
The carrying amount of financial assets represents the maximum credit exposure. The maximum exposure to credit risk at the end of the year was as follows:
|
|
2021 |
|
|
2020 |
|
||
Cash and Cash Equivalents |
|
|
336,197 |
|
|
|
111,733 |
|
Financial Assets at Fair Value through Profit or Loss |
|
|
1,004 |
|
|
|
8,319 |
|
Trade and Other Receivables |
|
|
190,966 |
|
|
|
72,785 |
|
Other Assets |
|
|
1,339 |
|
|
|
2,017 |
|
|
|
|
529,506 |
|
|
|
194,854 |
|
The table below discloses the credit risk rating for Trade and Other Receivables, based on external risk ratings of the geographical regions in which the Trade and Other Receivables are held:
Risk rating |
|
2021 |
|
|
2020 |
|
||
A |
|
|
20,839 |
|
|
|
7,544 |
|
B |
|
|
4,041 |
|
|
|
834 |
|
BB |
|
|
103,322 |
|
|
|
32,612 |
|
BBB |
|
|
26,960 |
|
|
|
9,787 |
|
CCC |
|
|
35,804 |
|
|
|
22,008 |
|
|
|
|
190,966 |
|
|
|
72,785 |
|
Financial Assets at Fair Value through profit or loss and cash and cash equivalents
Credit risk from balances with banks, financial institutions and other is managed by the Group in accordance with the Group’s policy. These financial instruments are debt securities and other financial instruments only conducted with carefully selected financial institutions in order to have an exposure to credit risk within acceptance levels of the Group.
Trade and Other Receivables
The Company operates with high-quality processors which mitigates credit risk. There are no significant concentrations of credit risk, whether through exposure to individual customers, specific industry sectors and/or regions.
The Group applies the IFRS 9 simplified approach to measuring expected credit losses which uses a lifetime expected loss allowance for all trade and other receivables. To measure the expected credit losses, trade and other receivables have been grouped based on shared credit risk characteristics and the days past due. Finally, historical loss experience is adjusted to reflect information about current conditions and reasonable and bearable forecasts of future economic conditions.
The expected loss rates are based on the payment profiles of sales, country of origin and the corresponding historical credit losses experienced within this period. The historical loss rates are adjusted to reflect current and forward-looking information on macroeconomic factors affecting the ability of the customers to settle the receivables. The Group has identified the credit rating of the countries in which it sells its services to be the most relevant factor, and accordingly adjusts the historical loss rates based on expected changes in credit ratings.
Market risk is the risk that the fair value or future cash flows of a financial instrument will fluctuate because of changes in market prices. For the Group, market risk may comprise interest rate risk and foreign currency risk and other price risk, such as equity price risk.
47
The objective of market risk management is to manage and control market risk exposures within acceptable parameters, while optimizing the return.
Interest Rate Risk
This risk arises from the possibility of the Group incurring losses due to fluctuations in interest rates in respect of fair value of future cash flows of a financial instrument. The Group’s cash flows are not exposed to interest rate risk since there are no financial instruments with variable interest rate and debt instruments are measured at fair value through profit and loss.
Foreign Currency Risk
The Group is exposed to currency risk on monetary amounts denominated in a currency other than the functional currency of the respective subsidiaries, mainly the Argentinian Peso, Chilean Peso, Euro and the Brazilian Real.
The following table presents the Group’s exposure to foreign currency risk as well as a sensitivity to a reasonably possible change in U.S. Dollar, with all other variables held constant. The impact on the Group’s profit before tax is due to changes in the fair value of monetary assets and liabilities.
2021 |
|
|
|
|
|
|
Gain/(loss) |
|
||||||||||||||
Account |
|
Currency |
|
Amount |
|
|
% increase |
|
|
Amount |
|
|
% decrease |
|
|
Amount |
|
|||||
Net balances |
|
Brazilian reais |
|
|
39,017 |
|
|
10% |
|
|
|
(3,902 |
) |
|
-10% |
|
|
|
3,902 |
|
||
|
|
Chilean pesos |
|
|
23,195 |
|
|
10% |
|
|
|
(2,320 |
) |
|
-10% |
|
|
|
2,320 |
|
||
|
|
Argentine pesos |
|
|
22,206 |
|
|
10% |
|
|
|
(2,221 |
) |
|
-10% |
|
|
|
2,221 |
|
||
|
|
Mexican pesos |
|
|
15,048 |
|
|
10% |
|
|
|
(1,503 |
) |
|
-10% |
|
|
|
1,503 |
|
||
|
|
South African rand |
|
|
7,515 |
|
|
10% |
|
|
|
(752 |
) |
|
-10% |
|
|
|
752 |
|
||
|
|
Indonesian rupiah |
|
|
4,370 |
|
|
10% |
|
|
|
(437 |
) |
|
-10% |
|
|
|
437 |
|
||
|
|
Peruvian Nuevo Sol |
|
|
4,021 |
|
|
10% |
|
|
|
(402 |
) |
|
-10% |
|
|
|
402 |
|
||
|
|
Colombian pesos |
|
|
4,010 |
|
|
10% |
|
|
|
(401 |
) |
|
-10% |
|
|
|
401 |
|
||
|
|
Euros |
|
|
3,563 |
|
|
10% |
|
|
|
(356 |
) |
|
-10% |
|
|
|
356 |
|
||
|
|
Uruguayan pesos |
|
|
3,323 |
|
|
10% |
|
|
|
(332 |
) |
|
-10% |
|
|
|
332 |
|
||
|
|
Nigerian nairas |
|
|
2,295 |
|
|
10% |
|
|
|
(230 |
) |
|
-10% |
|
|
|
230 |
|
||
|
|
Egyptian pounds |
|
|
562 |
|
|
10% |
|
|
|
(56 |
) |
|
-10% |
|
|
|
56 |
|
||
|
|
Paraguayan guaranís |
|
|
200 |
|
|
10% |
|
|
|
(20 |
) |
|
-10% |
|
|
|
20 |
|
||
|
|
Dominican pesos |
|
|
127 |
|
|
10% |
|
|
|
(13 |
) |
|
-10% |
|
|
|
13 |
|
||
|
|
Pakistanee rupees |
|
|
113 |
|
|
10% |
|
|
|
(11 |
) |
|
-10% |
|
|
|
11 |
|
||
|
|
Bangladeshi takas |
|
|
38 |
|
|
10% |
|
|
|
(4 |
) |
|
-10% |
|
|
|
4 |
|
||
|
|
Moroccan dirhams |
|
|
9 |
|
|
10% |
|
|
|
(1 |
) |
|
-10% |
|
|
|
1 |
|
||
|
|
Total |
|
|
129,612 |
|
|
|
— |
|
|
|
(12,961 |
) |
|
|
— |
|
|
|
12,961 |
|
48
2020 |
|
|
|
|
|
|
Gain/(loss) |
|
||||||||||||||
Account |
|
Currency |
|
Amount |
|
|
% increase |
|
|
Amount |
|
|
% decrease |
|
|
Amount |
|
|||||
Net balances |
|
Argentine pesos |
|
|
12,538 |
|
|
10% |
|
|
|
(1,254 |
) |
|
-10% |
|
|
|
1,254 |
|
||
|
|
Chilean pesos |
|
|
10,552 |
|
|
10% |
|
|
|
(1,055 |
) |
|
-10% |
|
|
|
1,055 |
|
||
|
|
Brazilian reais |
|
|
6,571 |
|
|
10% |
|
|
|
(657 |
) |
|
-10% |
|
|
|
657 |
|
||
|
|
Euros |
|
|
5,099 |
|
|
10% |
|
|
|
(510 |
) |
|
-10% |
|
|
|
510 |
|
||
|
|
Indian rupee |
|
|
2,806 |
|
|
10% |
|
|
|
(281 |
) |
|
-10% |
|
|
|
281 |
|
||
|
|
Mexican pesos |
|
|
1,725 |
|
|
10% |
|
|
|
(173 |
) |
|
-10% |
|
|
|
173 |
|
||
|
|
Uruguayan pesos |
|
|
1,692 |
|
|
10% |
|
|
|
(169 |
) |
|
-10% |
|
|
|
169 |
|
||
|
|
Nigerian nairas |
|
|
1,134 |
|
|
10% |
|
|
|
(113 |
) |
|
-10% |
|
|
|
113 |
|
||
|
|
Peruvian Nuevo Sol |
|
|
1,011 |
|
|
10% |
|
|
|
(101 |
) |
|
-10% |
|
|
|
101 |
|
||
|
|
Colombian pesos |
|
|
1,008 |
|
|
10% |
|
|
|
(101 |
) |
|
-10% |
|
|
|
101 |
|
||
|
|
Turkish lira |
|
|
699 |
|
|
10% |
|
|
|
(70 |
) |
|
-10% |
|
|
|
70 |
|
||
|
|
Indonesian rupiah |
|
|
228 |
|
|
10% |
|
|
|
(23 |
) |
|
-10% |
|
|
|
23 |
|
||
|
|
Chinese yuan renminbi |
|
|
221 |
|
|
10% |
|
|
|
(22 |
) |
|
-10% |
|
|
|
22 |
|
||
|
|
Paraguayan guaraní |
|
|
191 |
|
|
10% |
|
|
|
(19 |
) |
|
-10% |
|
|
|
19 |
|
||
|
|
Egyptian pounds |
|
|
141 |
|
|
10% |
|
|
|
(14 |
) |
|
-10% |
|
|
|
14 |
|
||
|
|
South African rand |
|
|
55 |
|
|
10% |
|
|
|
(5 |
) |
|
-10% |
|
|
|
5 |
|
||
|
|
Moroccan dirhams |
|
|
13 |
|
|
10% |
|
|
|
(1 |
) |
|
-10% |
|
|
|
1 |
|
||
|
|
Bolivian Boliviano |
|
|
12 |
|
|
10% |
|
|
|
(1 |
) |
|
-10% |
|
|
|
1 |
|
||
|
|
Kenyan shilling |
|
|
3 |
|
|
10% |
|
|
- |
|
|
-10% |
|
|
- |
|
||||
|
|
West African CFA franc |
|
|
2 |
|
|
10% |
|
|
- |
|
|
-10% |
|
|
- |
|
||||
|
|
Banbladeshi takas |
|
|
(32 |
) |
|
10% |
|
|
|
3 |
|
|
-10% |
|
|
|
(3 |
) |
||
|
|
Israeli New Shekel |
|
|
(103 |
) |
|
10% |
|
|
|
10 |
|
|
-10% |
|
|
|
(10 |
) |
||
|
|
Total |
|
|
45,566 |
|
|
|
— |
|
|
|
(4,556 |
) |
|
|
— |
|
|
|
4,556 |
|
Exposure is presented in thousands of U.S. Dollars and relates to monetary items in foreign currency of each entity of the Group, considering each individual functional currency. As explained in Note 24: Derivative financial instruments, the Company entered into foreign currency exchange forward contracts in order to mitigate this risk and reduce the impact on the financial statements.
Equity price risk
The Group is not exposed to equity price risk since it does not hold investments in equity instruments.
As at December 31st, 2021 and 2020, the Group had an investment in quoted debt securities. As of December 31, 2020 the Group invested in quoted mutual funds. This was a “cumulative” mutual funds that does not pay interest and the holder obtain capital gains. As at December 31st, 2021 and 2020, the exposure to equity price from such investment was considered not material.
Liquidity risk is the risk that the Group encounters difficulty in meeting the obligations associated with its financial liabilities that are settled by delivering cash or another financial asset. The Group’s approach to managing liquidity is to ensure, as far as possible, that it will always have sufficient liquidity to meet its liabilities when due, under both normal and stressed conditions, without incurring unacceptable losses or risking damage to the Group’s reputation.
The Group invests surplus cash in interest-bearing financial investments, choosing instruments with appropriate maturity or enough liquidity to provide adequate margin as determined by the forecasts.
Exposure to Liquidity Risk
The tables below analyze the Group’s financial liabilities into relevant maturity groupings based on their contractual maturities.
49
The amounts disclosed in the table are the contractual undiscounted cash flows. Balances due within 12 months equal their carrying balances as the impact of discounting is not significant.
Contractual maturities of financial liabilities |
|
Less than 6 |
|
|
6-12 months |
|
|
Between 1 and |
|
|
More than 2 years |
|
|
Total |
|
|
Carrying |
|
||||||
Non-derivatives |
|
|
|
|
|
|
|
|
|
|
|
|
|
|
|
|
|
|
||||||
Trade and other payables |
|
|
277,160 |
|
|
|
— |
|
|
|
— |
|
|
|
— |
|
|
|
277,160 |
|
|
|
277,160 |
|
Financial liabilities |
|
|
5,014 |
|
|
|
— |
|
|
|
— |
|
|
|
— |
|
|
|
5,014 |
|
|
|
5,014 |
|
Leases liabilities |
|
|
204 |
|
|
|
299 |
|
|
|
462 |
|
|
|
3,878 |
|
|
|
4,843 |
|
|
|
3,928 |
|
Total non-derivatives |
|
|
282,378 |
|
|
|
299 |
|
|
|
462 |
|
|
|
3,878 |
|
|
|
287,017 |
|
|
|
286,102 |
|
Derivatives |
|
|
|
|
|
|
|
|
|
|
|
|
|
|
|
|
|
|
||||||
Derivative financial instruments |
|
|
221 |
|
|
|
— |
|
|
|
— |
|
|
|
— |
|
|
|
221 |
|
|
|
221 |
|
Total derivatives |
|
|
221 |
|
|
|
— |
|
|
|
— |
|
|
|
— |
|
|
|
221 |
|
|
|
221 |
|
Contractual maturities of financial liabilities |
|
Less than 6 |
|
|
6-12 months |
|
|
Between 1 and |
|
|
Total |
|
|
Carrying |
|
|||||
Non-derivatives |
|
|
|
|
|
|
|
|
|
|
|
|
|
|
|
|||||
Trade and other payables |
|
|
142,865 |
|
|
|
— |
|
|
|
— |
|
|
|
142,865 |
|
|
|
142,865 |
|
Leases liabilities |
|
|
104 |
|
|
|
105 |
|
|
|
17 |
|
|
|
226 |
|
|
|
218 |
|
Total non-derivatives |
|
|
142,969 |
|
|
|
105 |
|
|
|
17 |
|
|
|
143,091 |
|
|
|
143,083 |
|
Derivatives |
|
|
|
|
|
|
|
|
|
|
|
|
|
|
|
|||||
Derivative financial instruments |
|
|
2,896 |
|
|
|
— |
|
|
|
— |
|
|
|
2,896 |
|
|
|
2,896 |
|
Total derivatives |
|
|
2,896 |
|
|
|
— |
|
|
|
— |
|
|
|
2,896 |
|
|
|
2,896 |
|
The Group’s transactions are susceptible to a fraudulent or improper sale and it uses processes to control the fraud risk. The process consists of monitoring transactions through ‘dLocal Defense’ which is a local data-driven prevention program to maximize fraud detection and minimize false positives. This process review transactions at the time of the authorization, legitimate them and use of external tools that are revised on a periodic basis.
The second process detects chargebacks and disputes. This is a supplemental process and increases the Group’s ability to avoid new frauds.
The Board’s policy is to maintain a strong capital base so as to maintain investor, creditor and market confidence and to sustain future development of the business. The Board’s objectives are to safeguard their ability to continue as a going concern, so that they can continue to provide returns for shareholders and benefits other stakeholders and to maintain an optimal capital structure to reduce the cost of capital. In order to maintain or adjust the capital structure, the Group may adjust the amount of dividends paid to shareholders, return capital to shareholders, issue new shares or sell assets to reduce debt. The Board of Directors monitors the return on capital as well as the level of dividends to ordinary shareholders.
As part of the requirements for maintaining its financial institution license, dLocal Limited, the Group’s licensee subsidiary is subject to a minimum capital requirement of EUR 400 imposed by the regulator of Malta.
The following tables show financial instruments recognized at fair value for the years ended December 31, 2021 and 2020, analyzed between those whose fair value is based on:
50
The table also includes financial instruments measured at amortized cost. The Group understands that the book value of such instruments approximates their fair value.
31 December 2021 |
|
FVPL |
|
|
Amortized |
|
|
Total |
|
|
Level 1 |
|
|
Level 2 |
|
|
Level 3 |
|
||||||
Assets |
|
|
|
|
|
|
|
|
|
|
|
|
|
|
|
|
|
|
||||||
Financial Assets at Fair Value through Profit or Loss |
|
|
1,004 |
|
|
|
— |
|
|
|
1,004 |
|
|
|
1,004 |
|
|
|
— |
|
|
|
— |
|
Other Assets |
|
|
— |
|
|
|
1,339 |
|
|
|
1,339 |
|
|
|
— |
|
|
|
— |
|
|
|
— |
|
Trade and Other Receivables |
|
|
— |
|
|
|
190,966 |
|
|
|
190,966 |
|
|
|
— |
|
|
|
— |
|
|
|
— |
|
Cash and Cash Equivalents |
|
|
— |
|
|
|
336,197 |
|
|
|
336,197 |
|
|
|
— |
|
|
|
— |
|
|
|
— |
|
|
|
|
1,004 |
|
|
|
528,502 |
|
|
|
529,506 |
|
|
|
1,004 |
|
|
|
— |
|
|
|
— |
|
31 December 2020 |
|
FVPL |
|
|
Amortized |
|
|
Total |
|
|
Level 1 |
|
|
Level 2 |
|
|
Level 3 |
|
||||||
Assets |
|
|
|
|
|
|
|
|
|
|
|
|
|
|
|
|
|
|
||||||
Financial Assets at Fair Value through |
|
|
|
|
|
|
|
|
|
|
|
|
|
|
|
|
|
|
||||||
Profit or Loss |
|
|
8,319 |
|
|
|
— |
|
|
|
8,319 |
|
|
|
8,319 |
|
|
|
— |
|
|
|
— |
|
Other Assets |
|
|
— |
|
|
|
2,017 |
|
|
|
2,017 |
|
|
|
— |
|
|
|
— |
|
|
|
— |
|
Trade and Other Receivables |
|
|
— |
|
|
|
72,785 |
|
|
|
72,785 |
|
|
|
— |
|
|
|
— |
|
|
|
— |
|
Cash and Cash Equivalents |
|
|
— |
|
|
|
111,733 |
|
|
|
111,733 |
|
|
|
— |
|
|
|
— |
|
|
|
— |
|
|
|
|
8,319 |
|
|
|
186,535 |
|
|
|
194,854 |
|
|
|
8,319 |
|
|
|
— |
|
|
|
— |
|
31 December 2021 |
|
FVPL |
|
|
Amortized |
|
|
Total |
|
|
Level 1 |
|
|
Level 2 |
|
|
Level 3 |
|
||||||
Liabilities |
|
|
|
|
|
|
|
|
|
|
|
|
|
|
|
|
|
|
||||||
Trade and Other Payables |
|
|
— |
|
|
|
(277,160 |
) |
|
|
(277,160 |
) |
|
|
— |
|
|
|
— |
|
|
|
— |
|
Financial liabilities |
|
|
— |
|
|
|
(5,014 |
) |
|
|
(5,014 |
) |
|
|
— |
|
|
|
— |
|
|
|
— |
|
Derivative financial instruments |
|
|
(221 |
) |
|
|
— |
|
|
|
(221 |
) |
|
|
— |
|
|
|
(221 |
) |
|
|
— |
|
Contingent consideration liability |
|
|
(665 |
) |
|
|
|
|
|
(665 |
) |
|
|
— |
|
|
|
— |
|
|
|
(665 |
) |
|
|
|
|
(886 |
) |
|
|
(282,174 |
) |
|
|
(283,060 |
) |
|
|
— |
|
|
|
(221 |
) |
|
|
(665 |
) |
31 December 2020 |
|
FVPL |
|
|
Amortized |
|
|
Total |
|
|
Level 1 |
|
|
Level 2 |
|
|
Level 3 |
|
||||||
Liabilities |
|
|
|
|
|
|
|
|
|
|
|
|
|
|
|
|
|
|
||||||
Trade and Other Payables |
|
|
— |
|
|
|
(142,865 |
) |
|
|
(142,865 |
) |
|
|
— |
|
|
|
— |
|
|
|
— |
|
Derivative financial instruments |
|
|
(2,896 |
) |
|
|
— |
|
|
|
(2,896 |
) |
|
|
— |
|
|
|
(2,896 |
) |
|
|
— |
|
|
|
|
(2,896 |
) |
|
|
(142,865 |
) |
|
|
(145,761 |
) |
|
|
— |
|
|
|
(2,896 |
) |
|
|
— |
|
Level 3 Financial Instruments
As of December 31, 2021, the Group has recognized a contingent consideration liability, described in Note 20, amounting to USD 665, classified in Level 3. The amount of the Level 3 contingent consideration was calculated by the finance team of the Group, using a discounted cash flow analysis, considering the expected cash flows based on terms of the contract, the entity’s knowledge of the business and how the current conditions are likely to impact it.
There were no changes in level 3 items for the years ended December 31, 2021 and 2020. Also, there were no transfer of items between level 2 and level 3, acquisitions, disposals nor gains or losses recognized in profit for the period related to level 3 instruments.
51
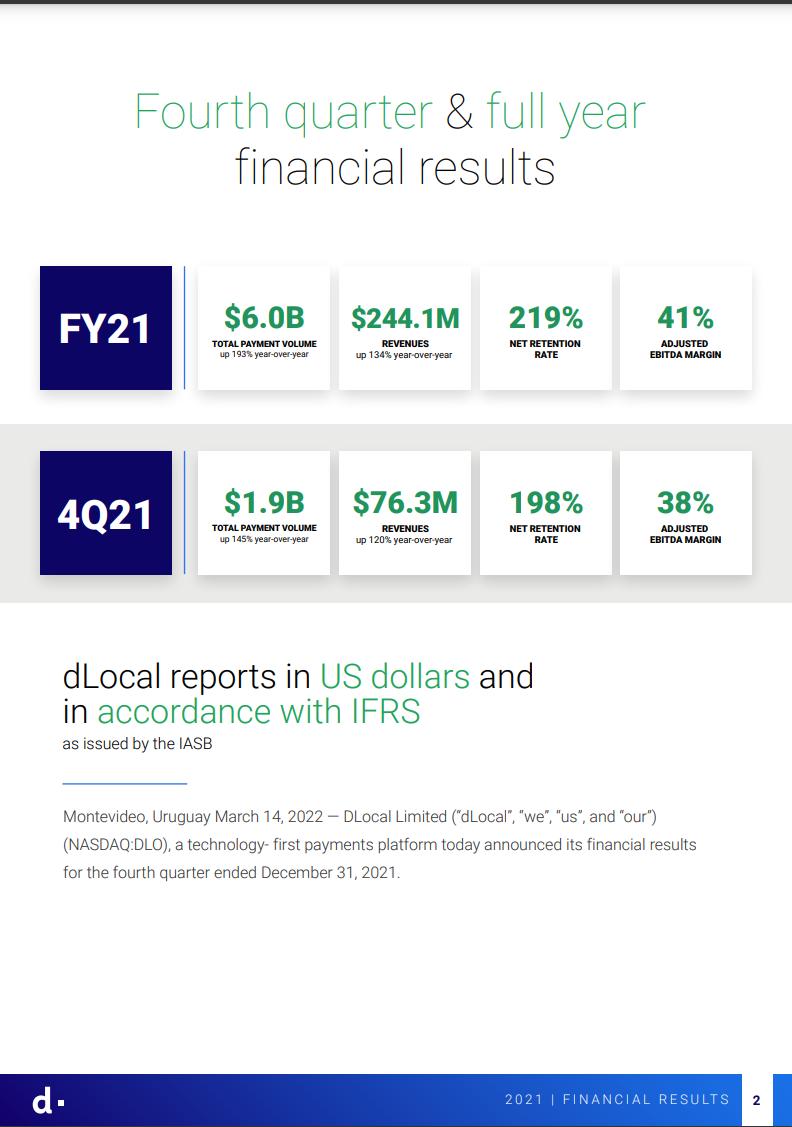

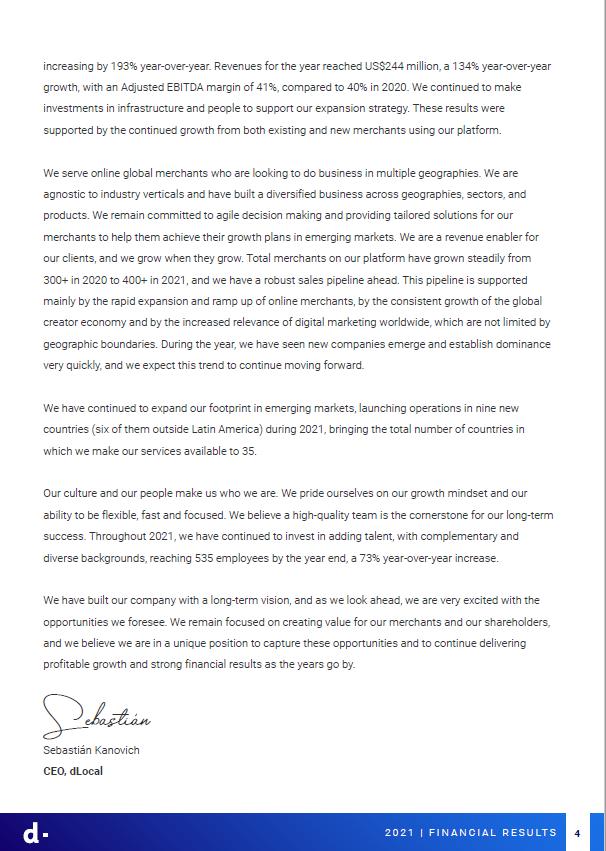
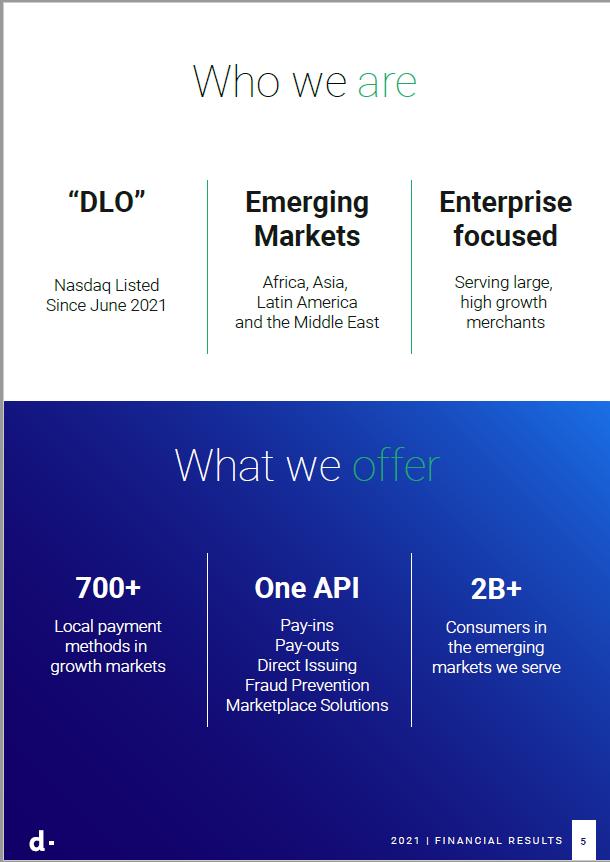
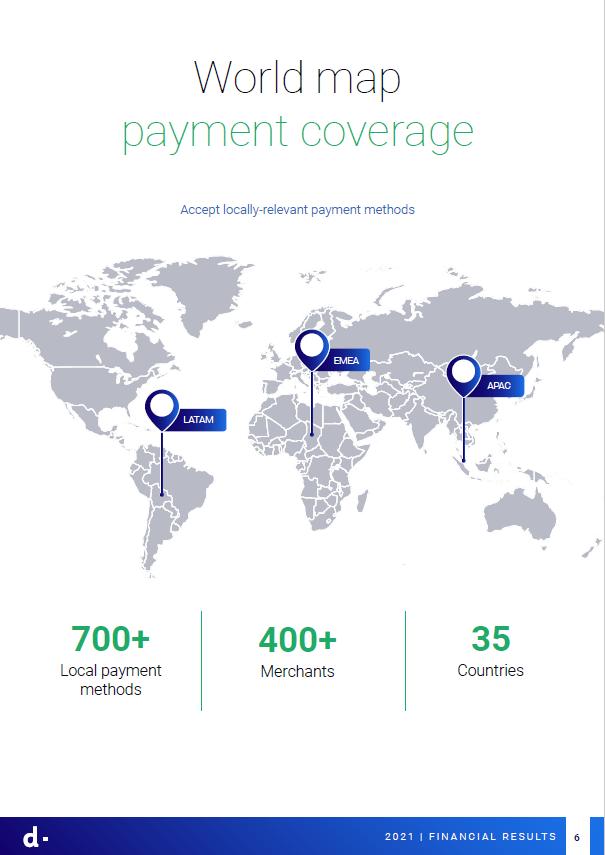

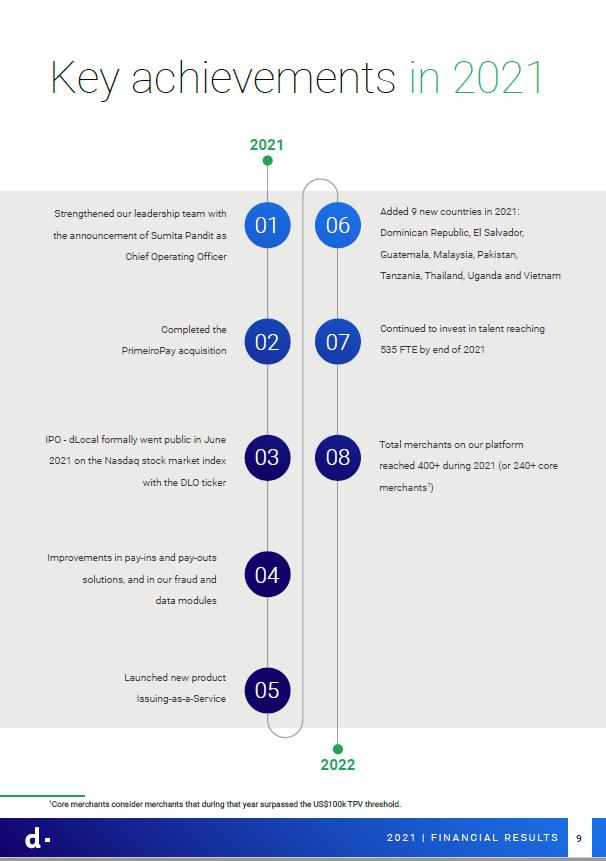
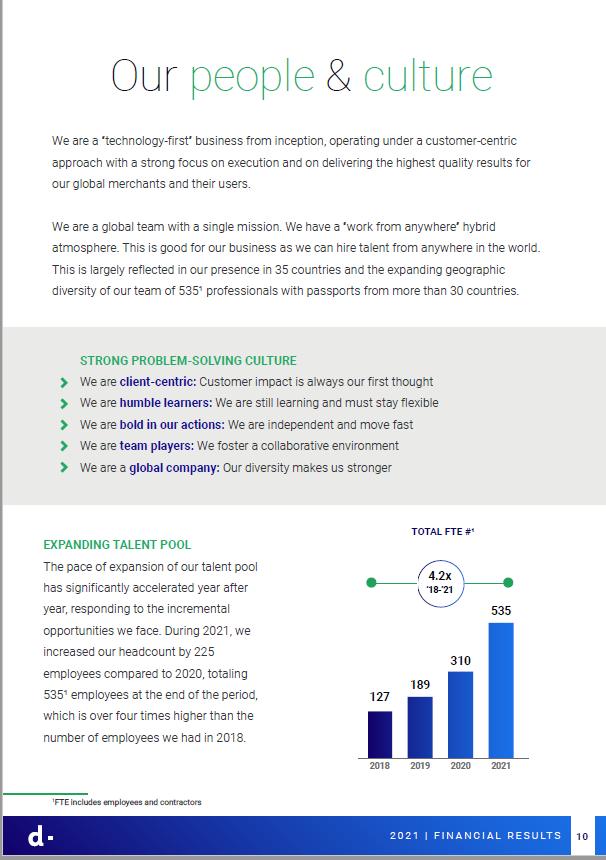
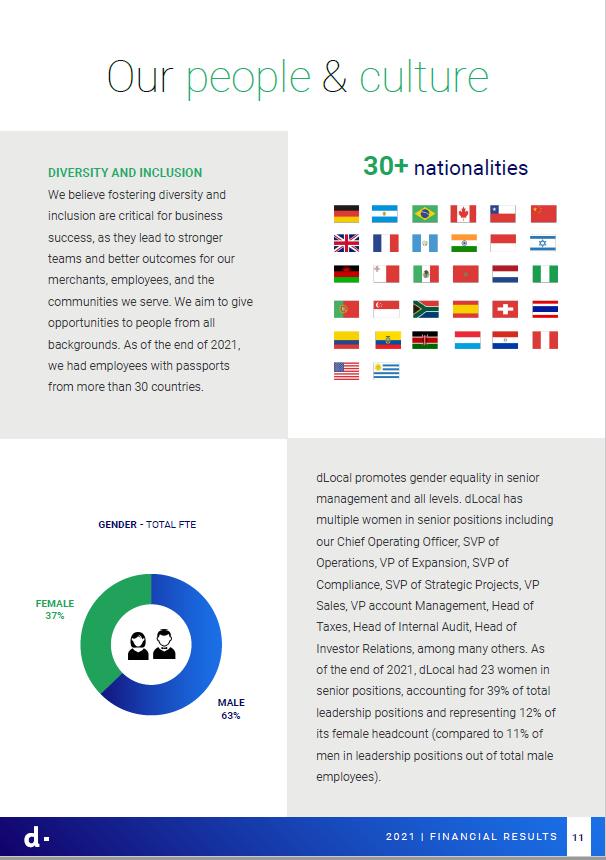

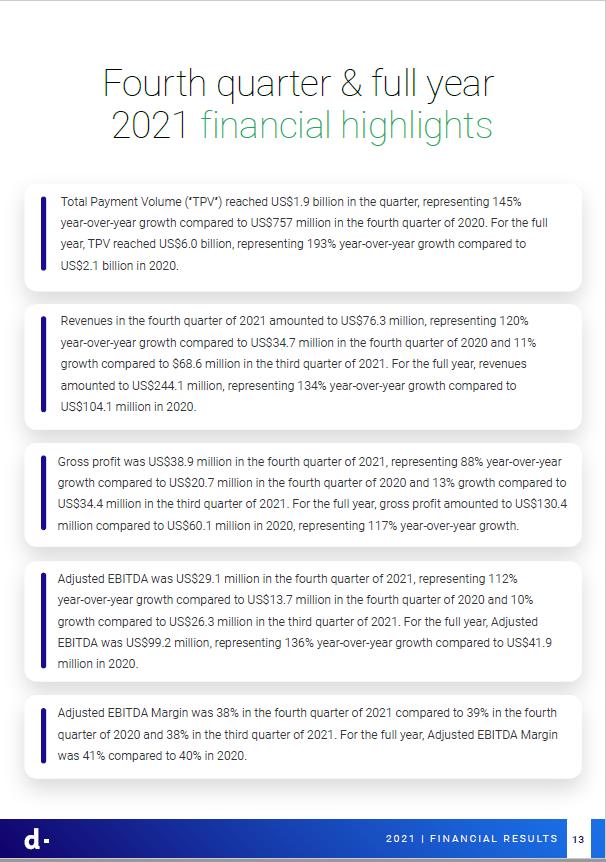
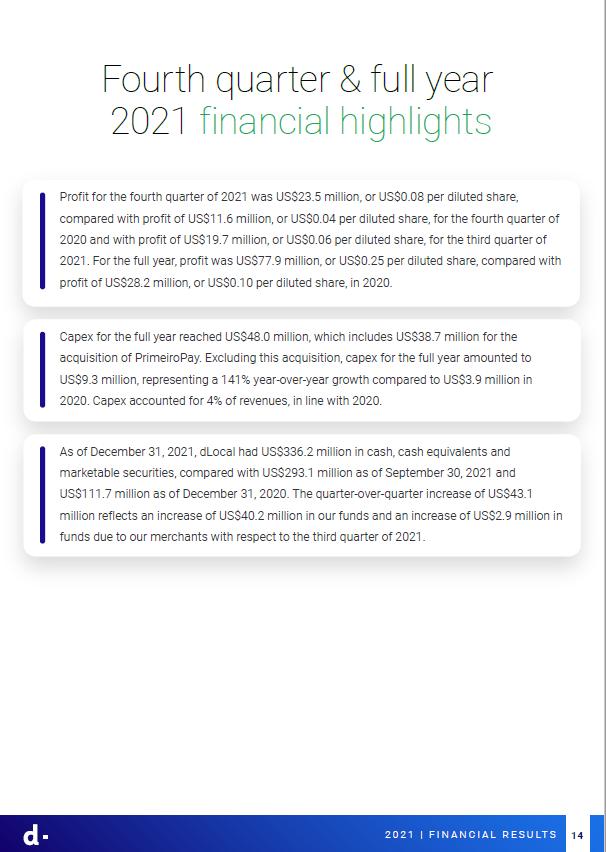
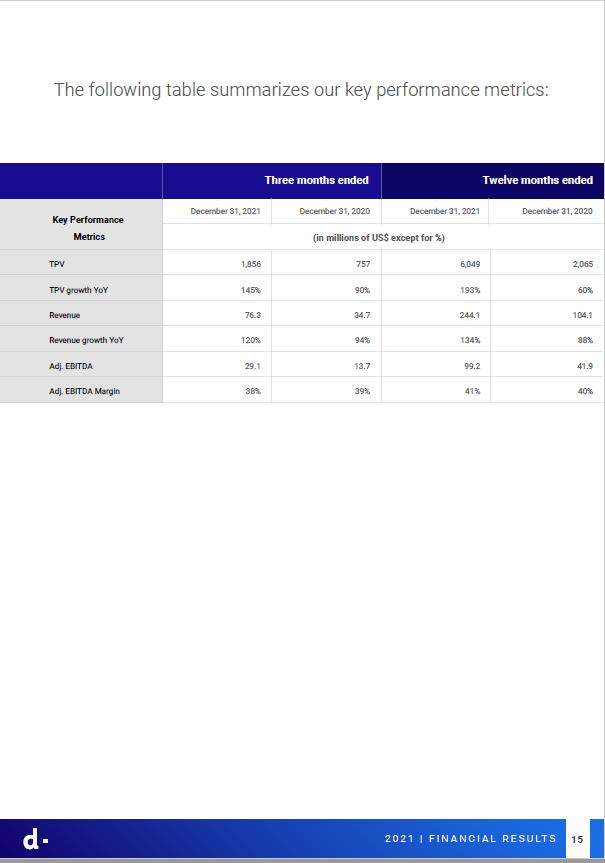
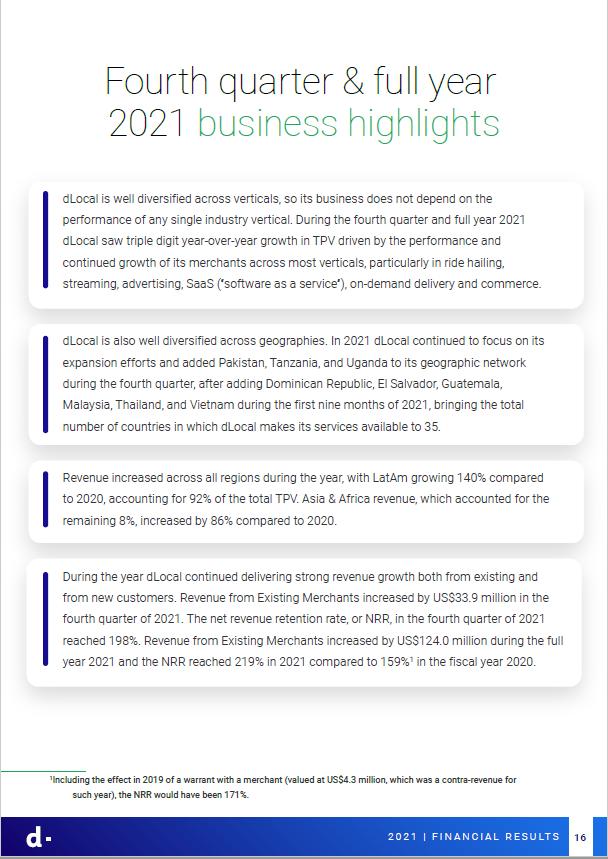
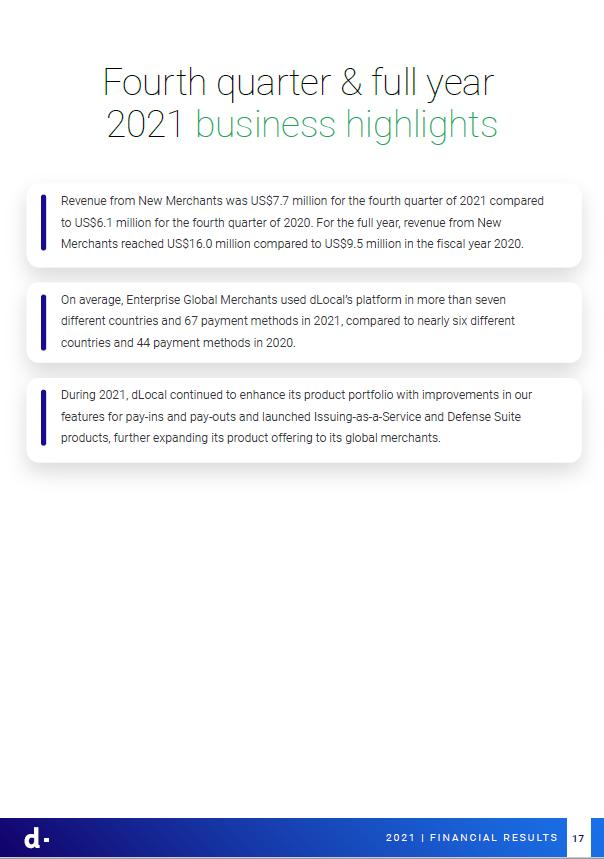
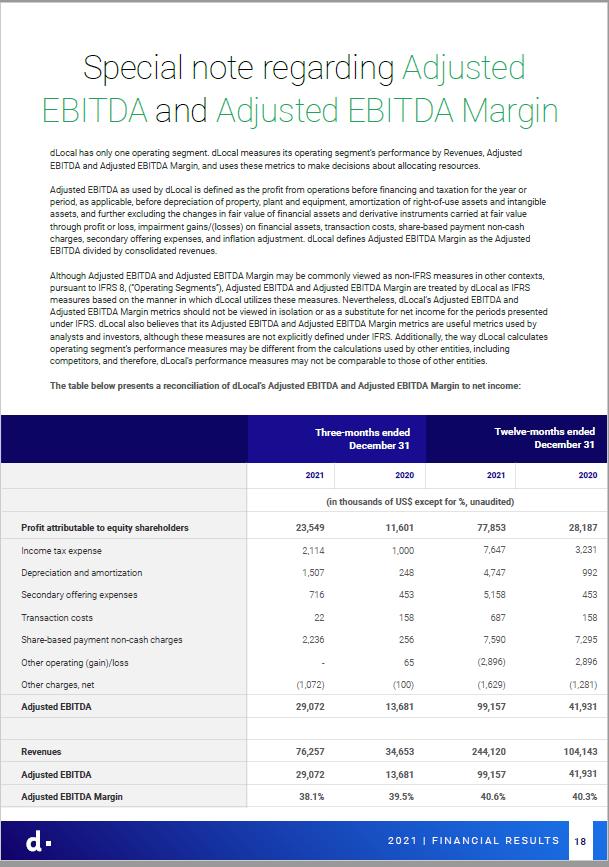
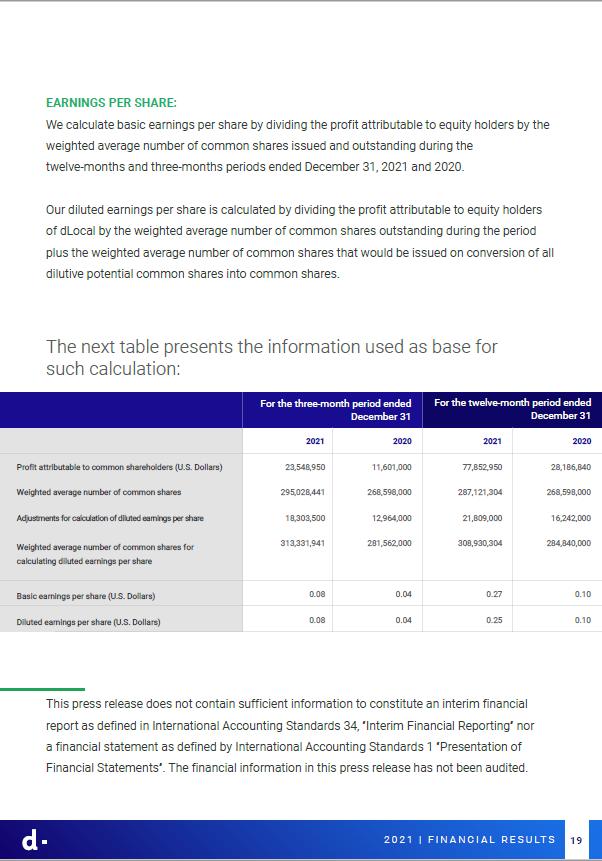

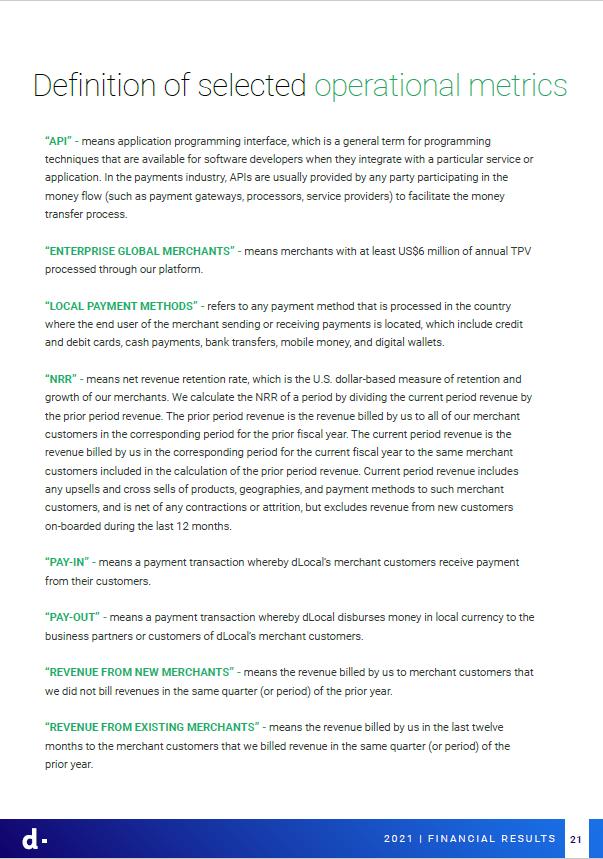
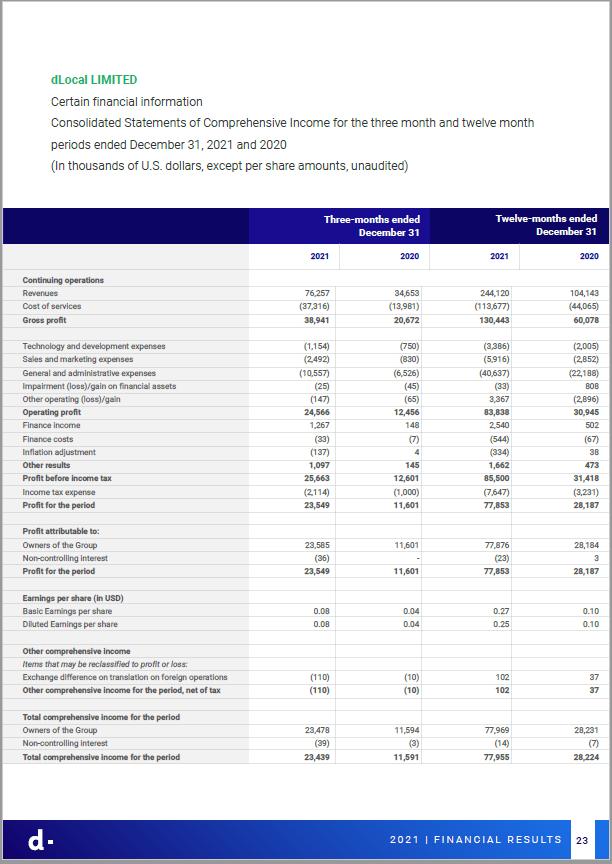
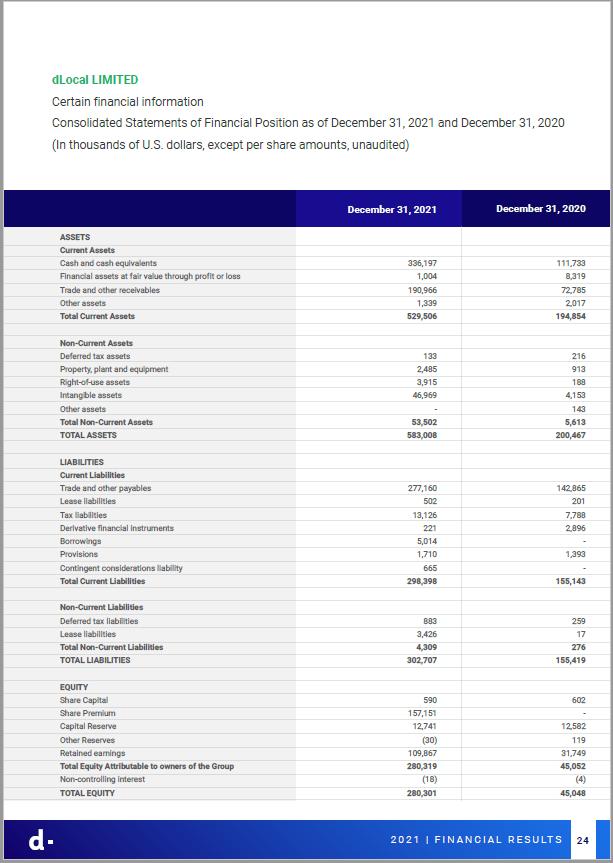


Q4 & FY 2021 Earnings Presentation NASDAQ: DLO

This presentation may contain forward-looking statements. These forward-looking statements convey DLocal’s current expectations or forecasts of future events. Forward-looking statements regarding DLocal involve known and unknown risks, uncertainties and other factors that may cause DLocal’s actual results, performance or achievements to be materially different from any future results, performances or achievements expressed or implied by the forward-looking statements. Certain of these risks and uncertainties are described in the “Risk Factors,” and “Cautionary Note Regarding Forward-Looking Statements” sections of DLocal’s filings with the U.S. Securities and Exchange Commission. Unless required by law, DLocal undertakes no obligation to publicly update or revise any forward-looking statements to reflect circumstances or events after the date hereof. Safe Harbor 2

1 dLocal has only one operating segment. Although Adjusted EBITDA and Adjusted EBITDA Margin may be commonly viewed as non-IFRS measures in other contexts, pursuant to IFRS 8, Adjusted EBITDA and Adjusted EBITDA Margin are treated by dLocal as IFRS measures based on the manner in which dLocal utilizes these measures. See detailed methodology for Adj. EBITDA and Adjusted EBITDA Margin in appendix. SCALE 3 2021: A Record Year FY21 219% NET RETENTION RATE 4Q21 $1.9B TPV 145% YoY Growth 198% NET RETENTION RATE GROWTH RETENTION $76.3M REVENUES 120% YoY Growth $6.0B TPV 193% YoY Growth $244.1M REVENUES 134% YoY Growth 41% ADJUSTED EBITDA MARGIN1 38% ADJUSTED EBITDA MARGIN1 PROFITABILITY

Strong Growth With Continuous Opportunities to Grow with our Existing Merchants 4 193% YoY TPV ($M) Selected Merchants

5 Powering Diverse High-Growth Verticals... Commerce Ride Hailing SaaS Gaming Crypto On-demand Delivery Streaming Ride Hailing Advertising Financial Services SaaS Travel eLearning

...Across 35 Emerging Markets Thailand El Salvador Argentina Brazil Chile China Turkey Uruguay Mexico Colombia Peru Paraguay India Morocco Indonesia Ecuador South Africa Nigeria Bolivia Bangladesh Cameroon Costa Rica Ghana Egypt Kenya Senegal Panama Philippines DR Vietnam Malaysia Guatemala Pakistan Uganda Tanzania Q4 ADDITIONS 2016 2017 2018 2019 2020 2021 6

High Growth Across All Regions 86% YoY 140% YoY Revenue by Region – LatAm ($M) Revenue by Region – Asia & Africa ($M) 7

New Merchants Increasing Diversification # of Merchants 190+ 300+ 400+ 2019 2020 2021 Revenue Concentration (% Revenue) Note: 1Core merchants consider merchants that during that year surpassed the US$100k TPV threshold. 90+ 150+ 240+ Total Merchants Core Merchants1 8

All Cohorts Driving Profitable Growth 9 TPV by Cohort1 ($M) 2021 Take Rate Performance by Cohort 1 2 3 4 Each cohort is driving solid TPV growth ’18 and ‘20 vintages experienced the highest YoY growth rates Cohorts with consistently higher starting points Cohort YoY Variation (p.p.) 2018 -0.2 p.p. 2019 -0.2 p.p. 2020 +0.1 p.p 2021 average take rate of 4% (versus 5% in 2020) Minimal variation in each cohort’s take-rate during the year Different cohorts have different pricing points 2021 cohort has a higher take rate than the 2021 average Note: 1Each cohort includes all merchants that began processing TPV in each period, regardless of volume of TPV processed.

10 Vectors of Future Growth Commercial Efforts Account management Organic growth New clients Products Develop new solutions Enhance portfolio Geographies Enter new countries Enhance presence Inorganic Initiatives

Consistently Improving Merchant Engagement 11 Note: Yearly figures consider merchants that during that year surpassed for the US$6M TPV threshold. Avg. # of Countries per Merchant Avg. # of Payment Methods per Merchant

12 Ramping-up Our Existing and New Clients Pipeline Note: For existing clients, includes all existing clients for which dLocal is at different stages of expansion to new markets, products, or payment methods. Retail 60+ 350+ 190+ 640+ Pre-IPO (Mar-21) As of 2022 +3x +2x EXISTING CLIENTS NEW CLIENTS # of Opportunities in our Sales Funnel Streaming Financial institutions Ride Hailing Advertising Travel SaaS Gaming E-Learning Illustrative industries Crypto Pricing proposal Go live

13 New cards and APMs integrations for processing redundancy, capability enhancements and global expansion Deepen our integration within Pix system in Brazil Network Tokenization E-mandate/Subscriptions management in India TaxManager: enhanced tax handling by country and payment method Increased card and APMs acceptance rates, with better Smart Routing, Chaining, and UX improvements through rigorous A/B testing Enhanced Product Portfolio Expanded Instant Payout offering in more countries Enhanced logics and automations to overcome local rail’s processing limitations Added direct connections with new partners/ banks for processing redundancy, capability enhancements and global expansion Enhanced our pay-in solution Enhanced our pay-out solution

14 Defense Suite launched Improved fraud prevention capabilities through: New Machine Learning models New API enhancements Device ID and fingerprinting Authentication through 3DS 2.0 and beyond Broaden Product Portfolio Enable merchants to issue prepaid virtual or physical cards, with spend and payment controls and account management B2B initiative focused on our merchants (no credit exposure), no direct issuing to end consumers Partner with local banks as issuers Improved our fraud and data capabilities Launched Issuing-as-a-Service

Our Ability to Hire Professionals with Diverse Backgrounds Worldwide is a Key Competitive Advantage Note: FTE includes employees and contractors. 1 The total engineers or technology-related roles for 2021 represented 44% of total FTEs, including those outside of Technology & Product team. 73% YoY 118% YoY 61% YoY Technology & Product1 Sales & Marketing Operations & Corporate 535 FTE in 2021 (+73% YoY) We have a wide talent pool We hire anywhere in the world As of 2021YE, we had employees with diverse nationalities FTE Evolution (#) We continue to invest in hiring top talent for Tech & Product and S&M to our team 30+ nationalities 15

FINANCIAL HIGHLIGHTS 16

TPV Almost Tripled in 2021 17 193% YoY 145% YoY Continued growth of our TPV across most verticals, particularly in ride hailing, streaming, advertising, SaaS, on-demand delivery and commerce TPV ($M)

18 Strong and Steady Growth in Pay-Ins; Short-term Fluctuations in Pay-Outs 64% YoY 242% YoY 124% YoY Pay-ins TPV Pay-outs TPV Pay-Ins and Pay-Outs TPV ($M) 190% YoY

Triple-Digit-Growth in Revenue 19 134% YoY 120% YoY Revenue ($M) Note: Audited results for the years ended December 31, 2021, December 31, 2020, and December 31, 2019.

Note: 1 “NRR” means Net Revenue Retention rate, which is the U.S. dollar-based measure of retention and growth of our merchants. We calculate the NRR of a period by dividing the Current Period Revenue by the Prior Period Revenue. The Prior Period Revenue is the revenue billed by us to all our customers in the prior period. The Current Period Revenue is the revenue billed by us in the current period to the same customers included in the Prior Period Revenue. Current Period Revenue includes any upsells and cross sells of products, geographies, and payment methods to such merchant customers, and is net of any contractions or attrition, but excludes revenue from new customers onboarded in the last 12 months. Existing and New Merchants Driving Growth 20 Existing Merchants: Revenues from merchants that we already processed in the same period of the previous year. New Merchants: Revenues from merchants onboarded during the last twelve months. This is a rolling measure for each new quarter, based on merchants’ classification (new vs. existing) 198% NRR1 Revenue Composition ($M) 219% NRR1

21 Note: Audited results for the years ended December 31, 2021, December 31, 2020, and December 31, 2019. Gross Profit Continues to Grow at Sound Rates 117% YoY 88% YoY Gross Profit ($M)

22 Note: Note: Audited results for the years ended December 31, 2021, December 31, 2020, and December 31, 2019. 1 dLocal has only one operating segment. Although Adj. EBITDA and Adj. EBITDA Margin may be commonly viewed as non-IFRS measures in other contexts, pursuant to IFRS 8, Adjusted EBITDA and Adjusted EBITDA Margin are treated by dLocal as IFRS measures based on the manner in which dLocal utilizes these measures. See detailed methodology for Adj. EBITDA and Adjusted EBITDA Margin in appendix. Maintained Strong Margins Amid Continue Investing in Growth 136% YoY 112% YoY Adjusted EBITDA1 ($M) and Adjusted EBITDA Margin (%)

CLOSING REMARKS 23

We power a massive and expanding Emerging Markets ecosystem We have built a scalable, single API technology infrastructure that makes the complex simple for merchants across Emerging Markets We are growing rapidly and profitably at scale We are directly integrated with some of the biggest online merchants in the world, driving very strong net revenue retention and strong cohort performance Our business model is well-diversified across industries and clients 24 Investment Highlights

Thank you!

APPENDIX 26

Complex and changing regulatory and tax frameworks Poor conversion and high fraud Multiple local payment methods with rising fragmentation What Problems are we Addressing? 27

3Q21 Adjusted EBITDA Bridge ($M) 1 4Q21 Adjusted EBITDA Bridge ($M) 2 Note: Adjusted EBITDA excludes one-off expenses and non-cash items. Unaudited results for the quarter ended September 30, 2021. 1 Other Adjustments for 4Q21 includes secondary offerings expenses ($0.7M) and M&A transaction costs ($0.02M). 2 Other Adjustments for 3Q21 includes secondary offerings expenses ($0.7M) and M&A transaction costs ($0.2M). Financial Highlights 28

29 $ in thousands Three-month period ended December 31, Twelve-month period ended December 31, 2021 2020 2021 2020 Profit for the period 23,549 11,601 77,853 28,187 Income tax expense 2,114 1,000 7,647 3,231 Other operating (gain)/loss - 65 (2,896) 2,896 Depreciation and amortization 1,507 248 4,747 992 Secondary offering expenses1 716 453 5,158 453 Transaction costs2 22 158 687 158 Share-based payment charges 2,236 256 7,590 7,295 Other charges, Net3 (1,072) (100) (1,629) (1,281) Adjusted EBITDA 29,072 13,681 99,157 41,931 Note: Although Adj. EBITDA and Adj. EBITDA Margin may be commonly viewed as non-IFRS measures in other contexts, pursuant to IFRS 8, Adjusted EBITDA and Adjusted EBITDA Margin are treated by dLocal as IFRS measures based on the manner in which dLocal utilizes these measures. Adjusted EBITDA as used by dLocal is defined as the profit from operations before financing and taxation for the year or period, as applicable, before depreciation of property, plant and equipment, amortization of right-of-use assets and intangible assets, and further excluding the changes in fair value of financial assets and derivative instruments carried at fair value through profit or loss, impairment gains/(losses) on financial assets, transaction costs, share-based payment non-cash charges, secondary offering expenses, transaction expenses and inflation adjustment. 1 Corresponds to expenses assumed by dLocal in relation to secondary offerings of its shares. 2 Corresponds to costs related to the acquisition of assets of PrimeiroPay. 3 Corresponds to other minor adjustments (full reconciliation in financial statements) Reconciliation of Adjusted EBITDA to Profit