UNITED STATES
SECURITIES AND EXCHANGE COMMISSION
Washington, D.C. 20549
FORM 6-K
REPORT OF FOREIGN PRIVATE ISSUER
PURSUANT TO RULE 13a-16 OR 15d-16
UNDER THE SECURITIES EXCHANGE ACT OF 1934
For the month of April 2023
Commission File Number: 001-40451
DLocal Limited
(Exact name of registrant as specified in its charter)
Dr. Luis Bonavita 1294
Montevideo
Uruguay 11300
+1 (424) 392-7437
(Address of principal executive office)
Indicate by check mark whether the registrant files or will file annual reports under cover of Form 20-F or Form 40-F:
Form 20-F ☒ Form 40-F ☐
Indicate by check mark if the registrant is submitting the Form 6-K in paper as permitted by Regulation S-T Rule 101(b)(1):
Yes ☐ No ☒
Indicate by check mark if the registrant is submitting the Form 6-K in paper as permitted by Regulation S-T Rule 101(b)(7):
Yes ☐ No ☒
TABLE OF CONTENTS
EXHIBIT
|
|
|
99.1 |
|
|
|
||
99.2 |
|
Annual Report 2022 - dLocal Reports 2022 Fourth Quarter & full year Financial results |
|
||
99.3 |
|
|
SIGNATURE
Pursuant to the requirements of the Securities Exchange Act of 1934, the registrant has duly caused this report to be signed on its behalf by the undersigned, thereunto duly authorized.
|
DLocal Limited |
|
|
|
|
|
|
|
By: |
/s/ Diego Cabrera Canay |
|
|
Name: |
Diego Cabrera Canay |
|
|
Title: |
Chief Financial Officer |
|
Date: April 5, 2023
Exhibit 99.1

dLocal Reports Fourth Quarter and Full Year 2022 Financial Results
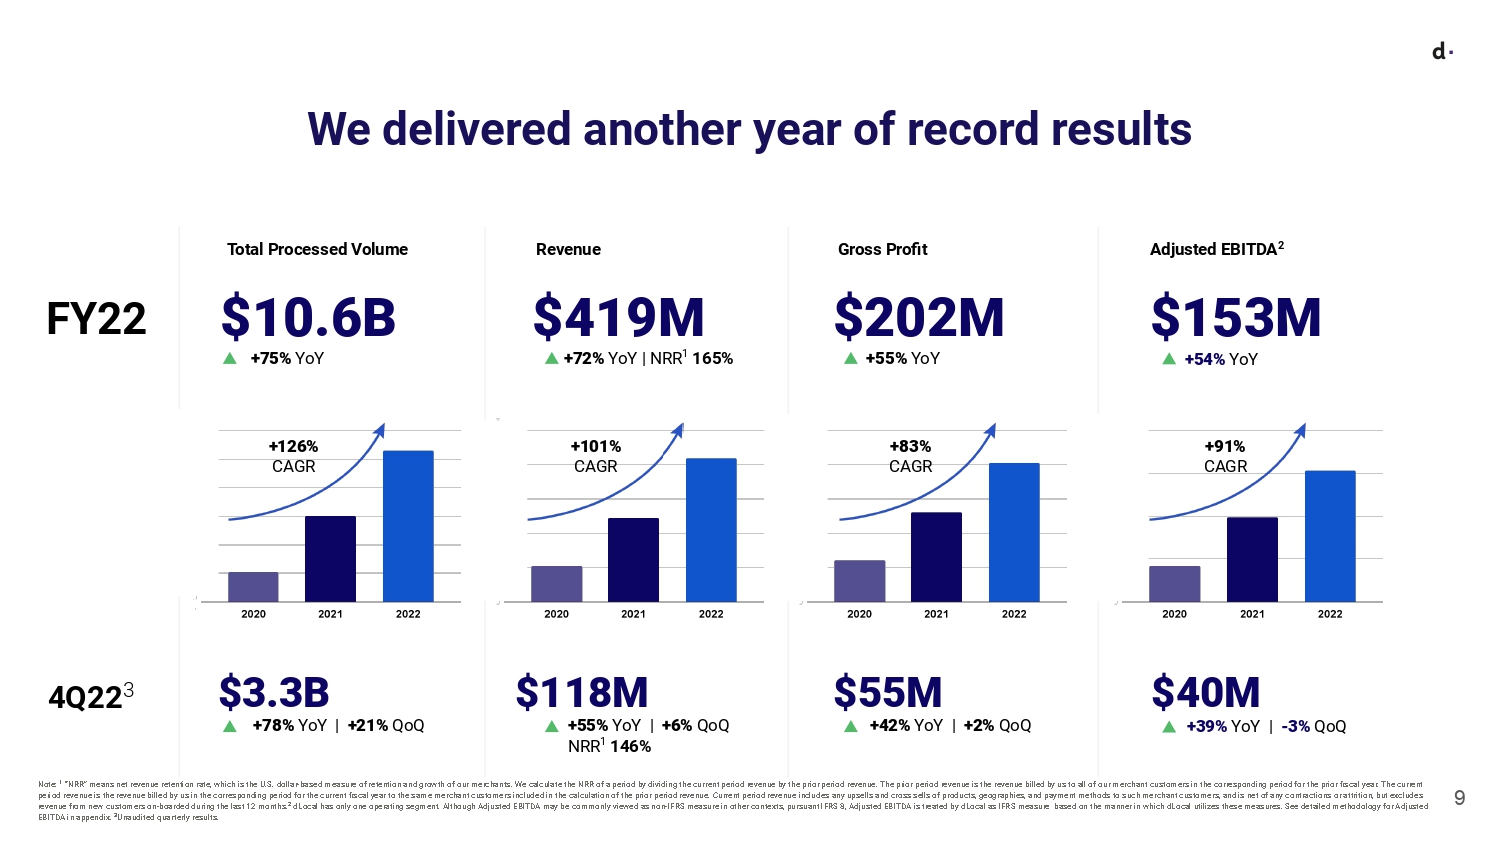
Full Year 2022
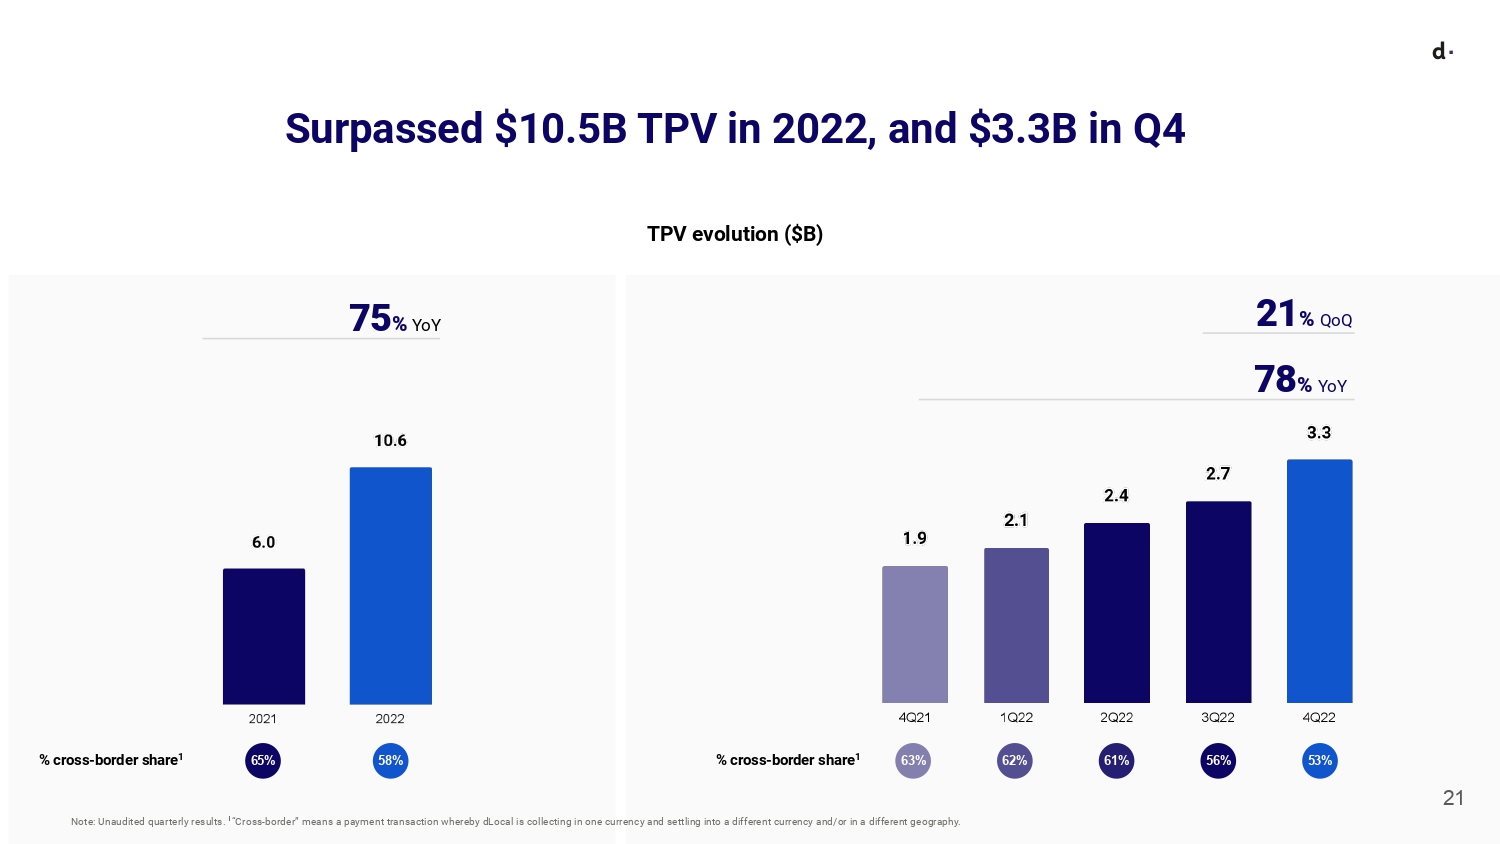
US$10.6 billion Total Payment Volume, up 75% year-over-year
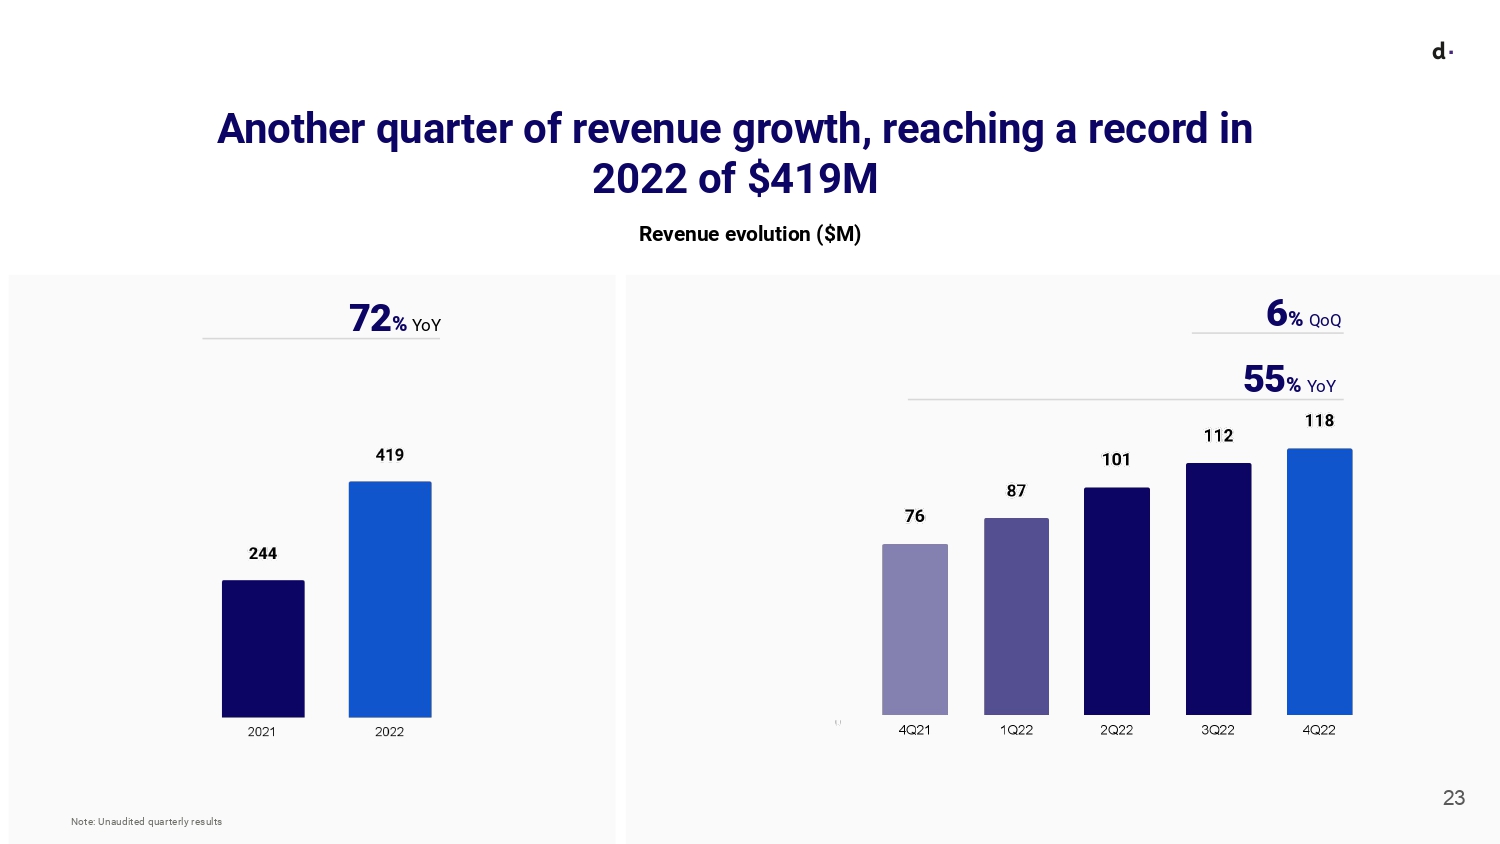
Revenue of US$419 million, up 72% year-over-year
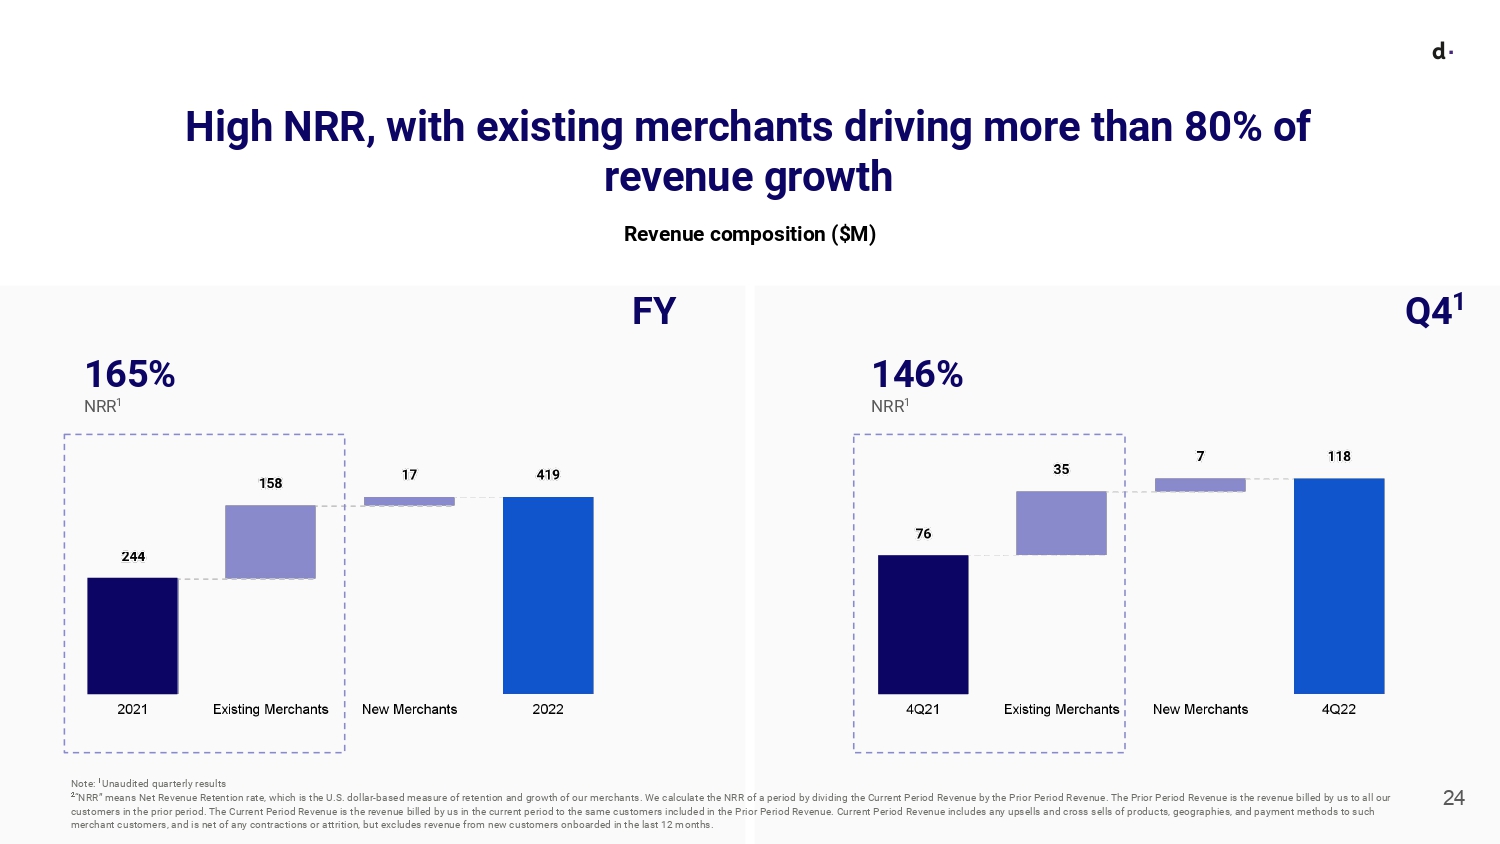
165% Net Revenue Retention Rate
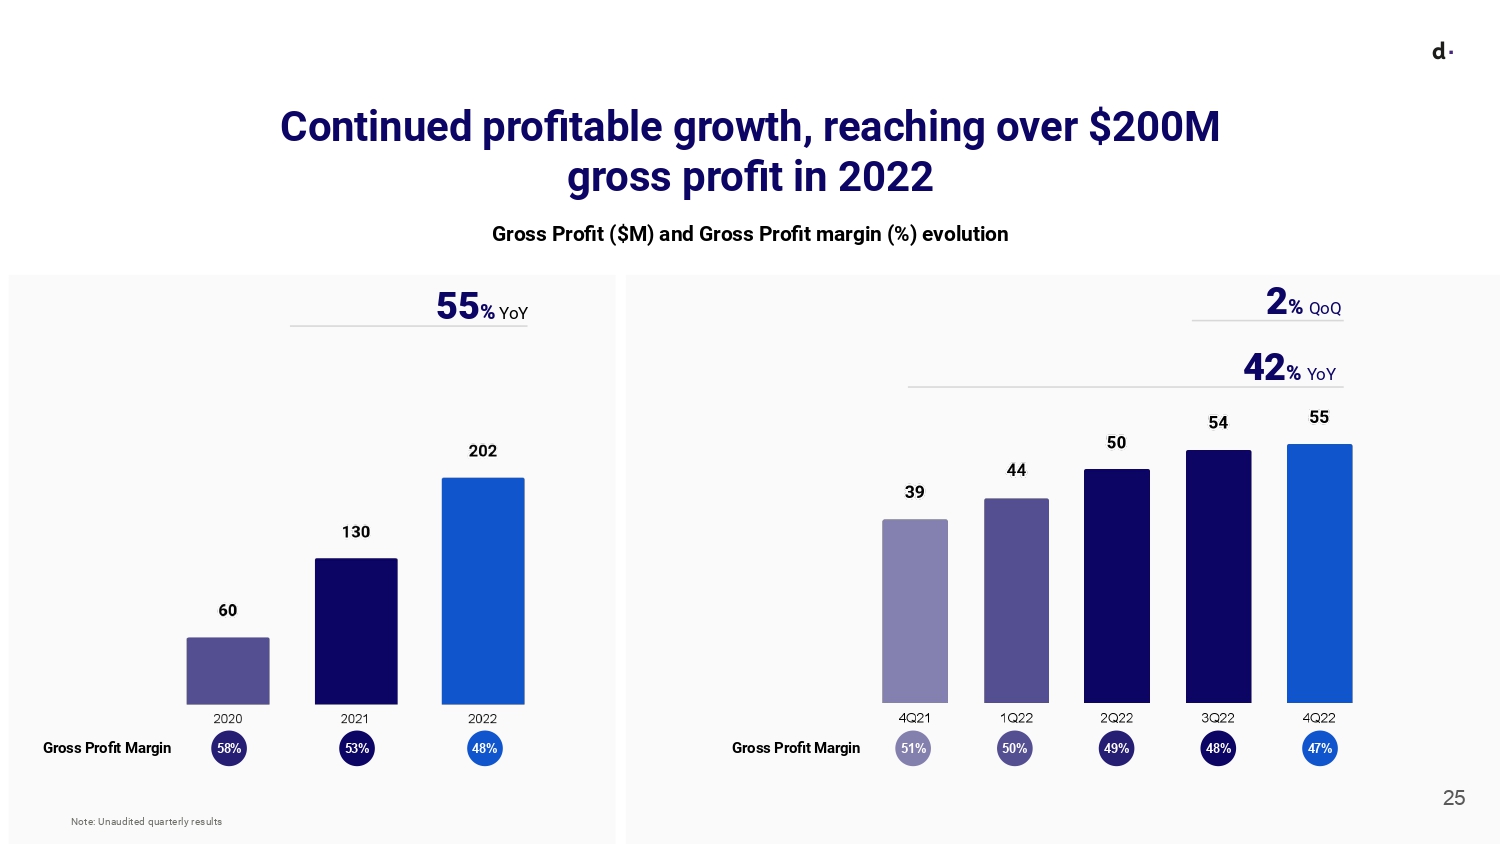
Gross Profit of US$202 million, up 55% year-over-year
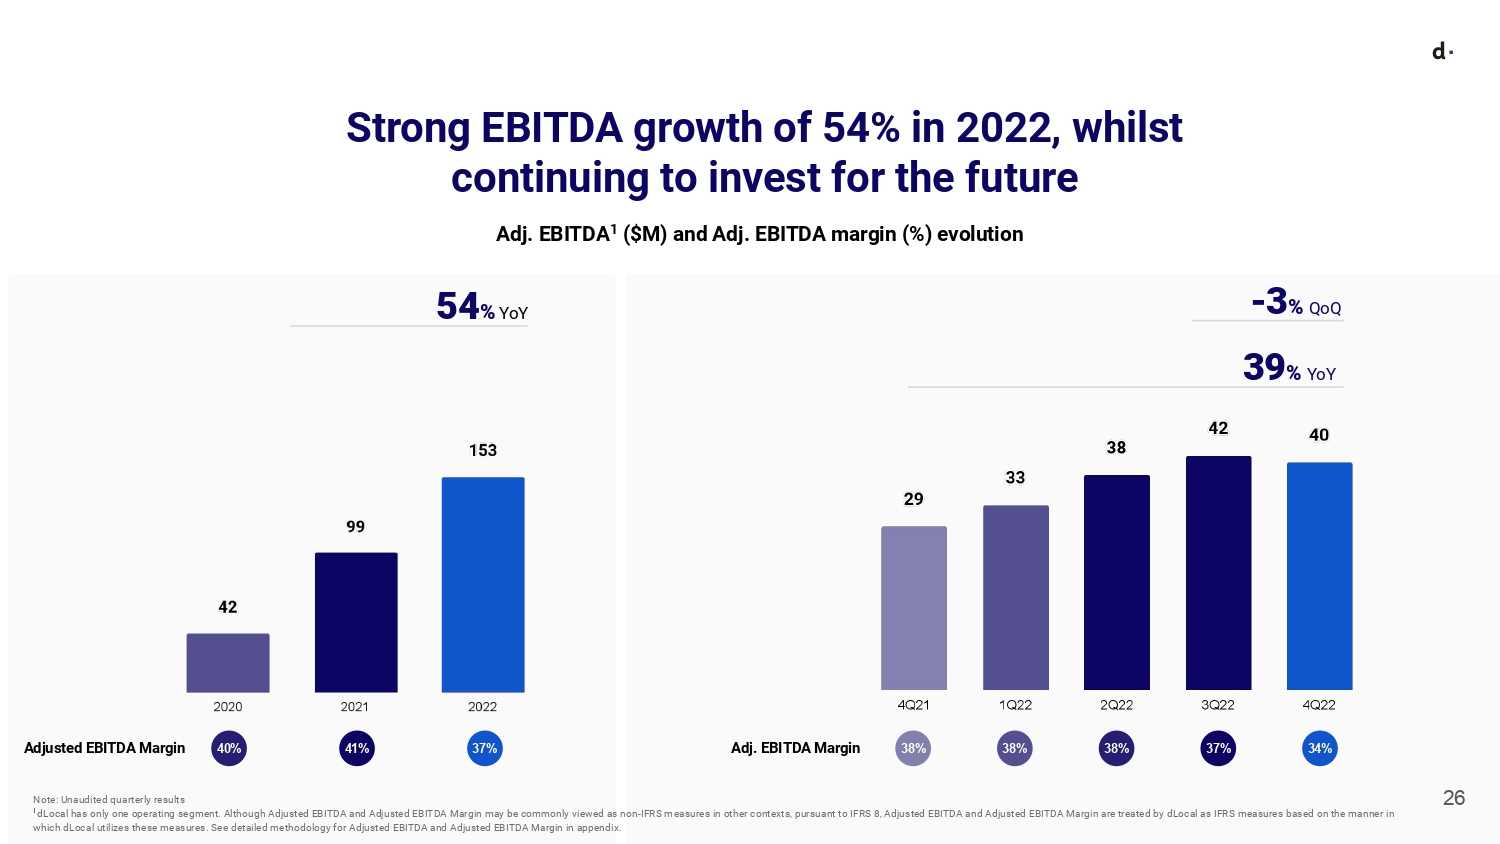
Adjusted EBITDA of US$153 million, up 54% year-over-year
Fourth Quarter 2022
US$3.3 billion Total Payment Volume, up 78% year-over-year and 21% quarter-over-quarter
Revenue of US$118 million, up 55% year-over-year and 6% quarter-over-quarter
146% Net Revenue Retention Rate
Gross Profit of US$55 million, up 42% year-over-year and 2% quarter-over-quarter
Adjusted EBITDA of US$40 million, up 39% year-over-year and down 3% quarter-over-quarter
dLocal reports in US dollars and in accordance with IFRS as issued by the IASB
Montevideo, Uruguay April 4th, 2023 — DLocal Limited (“dLocal”, “we”, “us”, and “our”) (NASDAQ:DLO), a technology - first payments platform today announced its financial results for the fourth quarter ended December 31, 2022.
“We are delighted to report that 2022 was another exceptional year for our company. We successfully navigated unprecedented territory in late 2022 and I could not be more thankful for and proud of our team, which remained steadfast in its commitment to our long-term ambition. We also want to extend our gratitude to our customers, whose trust in our company continues to be the driving force behind our success. Our strong 2022 results, with TPV growing 75% year–over-year to US$10.6 billion, are a testament to the value of our solutions and to our true long-term partnerships. In addition, I want to thank our long-term investor partners. We have seen key shareholders recently increasing their positions, showing their confidence in and excitement about the future of dLocal. We remain humble and focused as we continue to redefine the online payments experience in emerging markets.
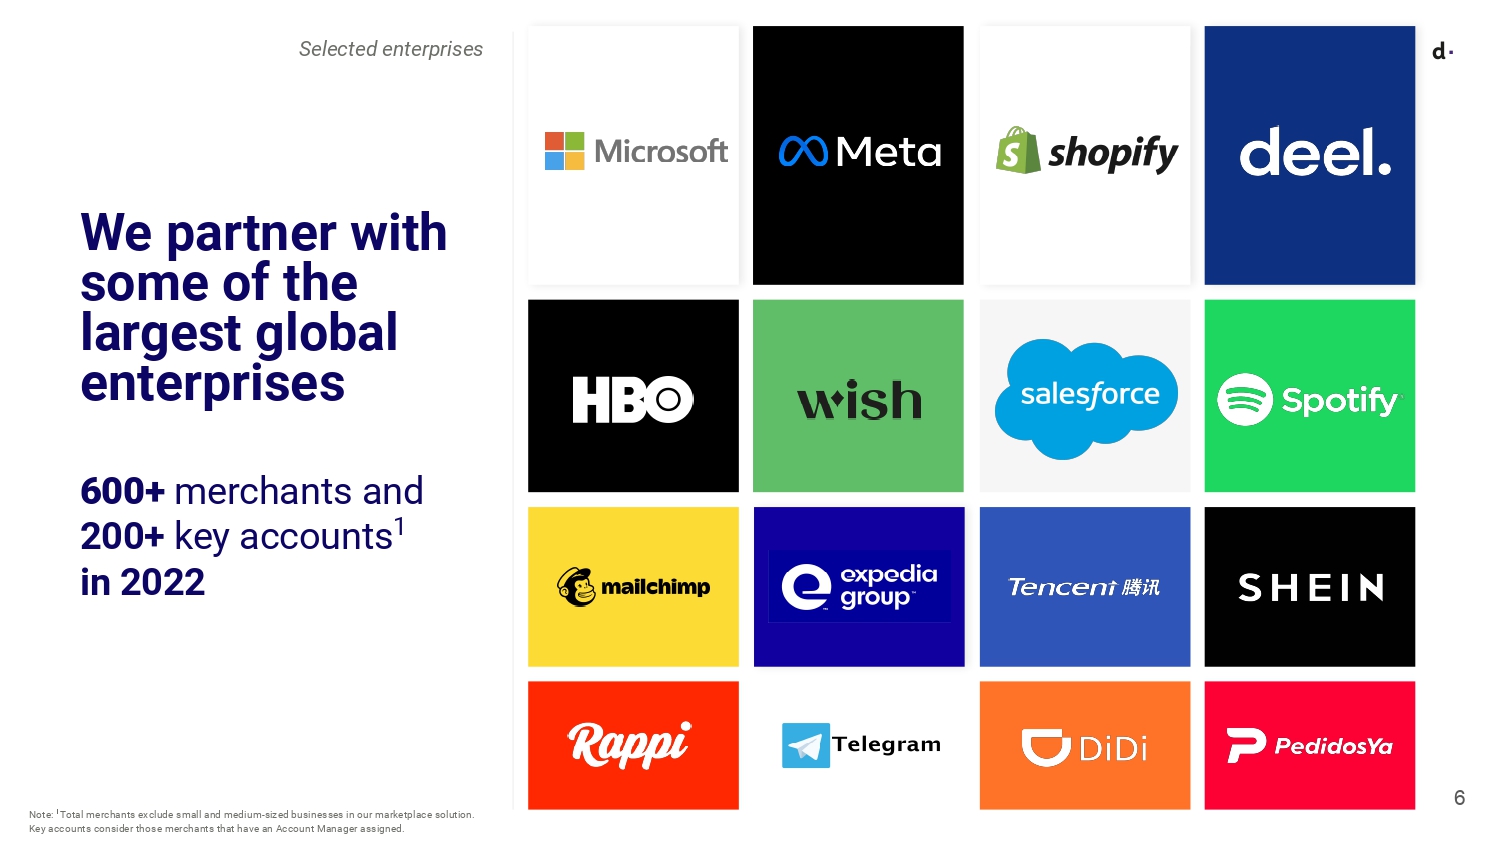
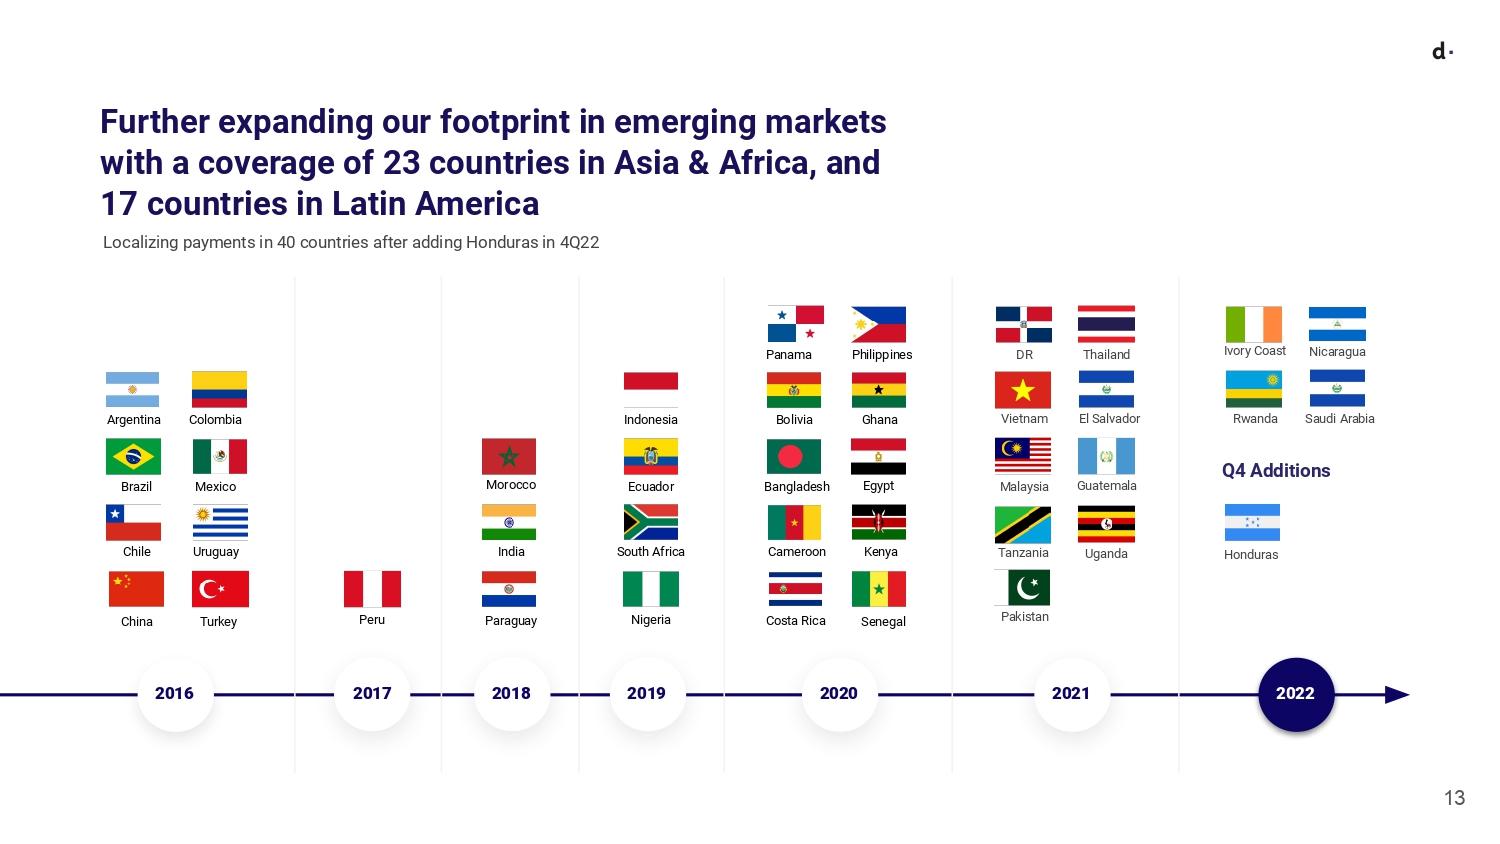
Our flexible and scalable platform has been a cornerstone of our success from day one. In response to global merchant needs and payments ecosystems, we have introduced new solutions and capabilities, expanding our technology platform. We grew our merchant base from 300+ in 2020 to over 600 in 2022, with a robust sales pipeline ahead as we enter 2023. We continued to expand our footprint in emerging markets, launching operations in five new countries during 2022. Unlocking countries that our merchants need has ultimately come to differentiate us. Today, through our one dLocal model - one API, one platform, one contract, we offer many of the most prestigious global companies the potential to reach billions of users across 40 countries, powering over 900 payment methods through local-to-local and cross-border online pay-in and pay-out transactions.
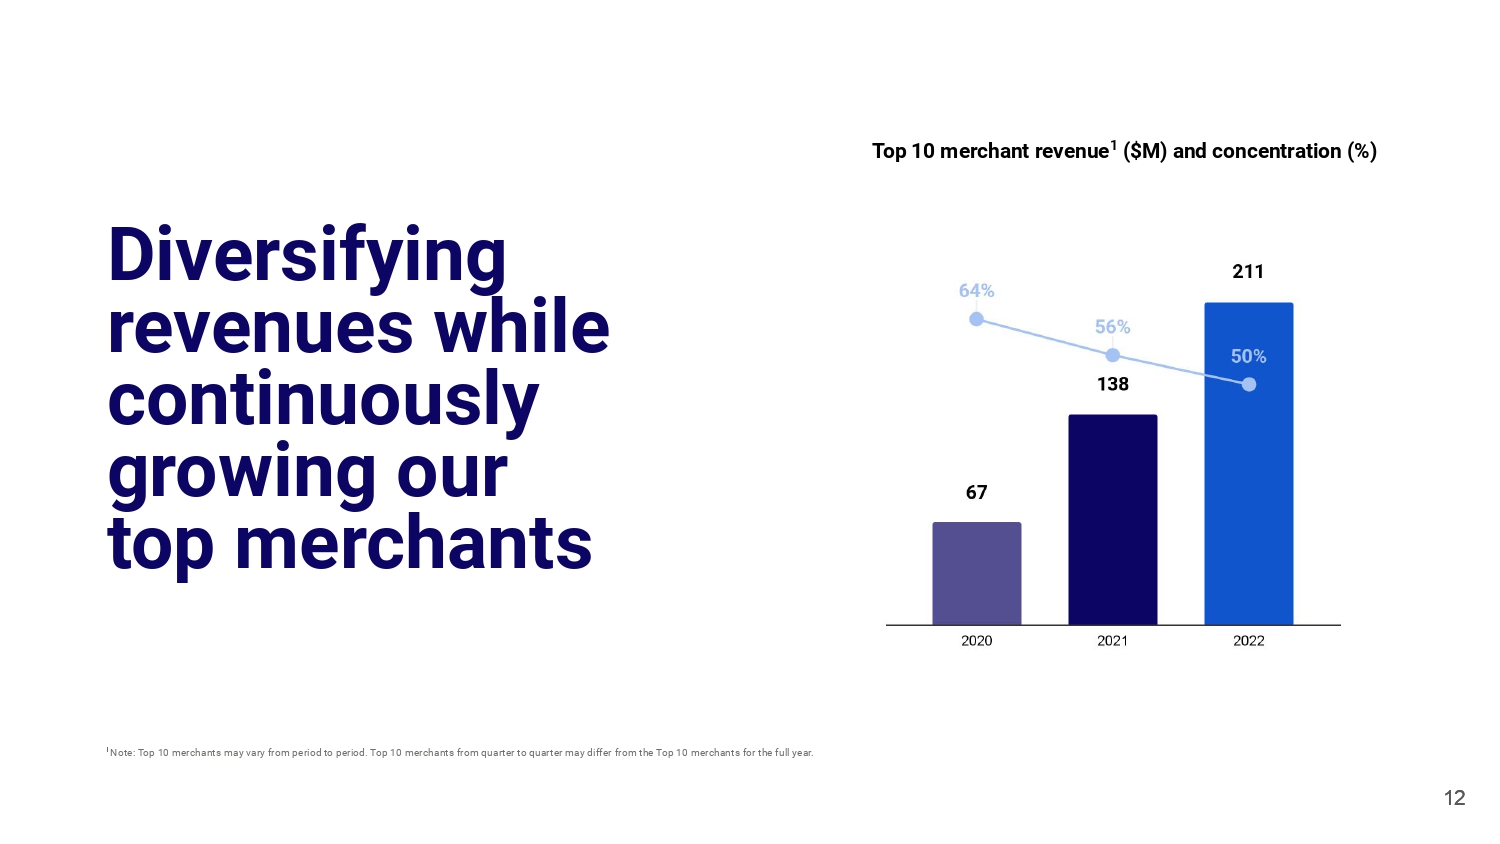
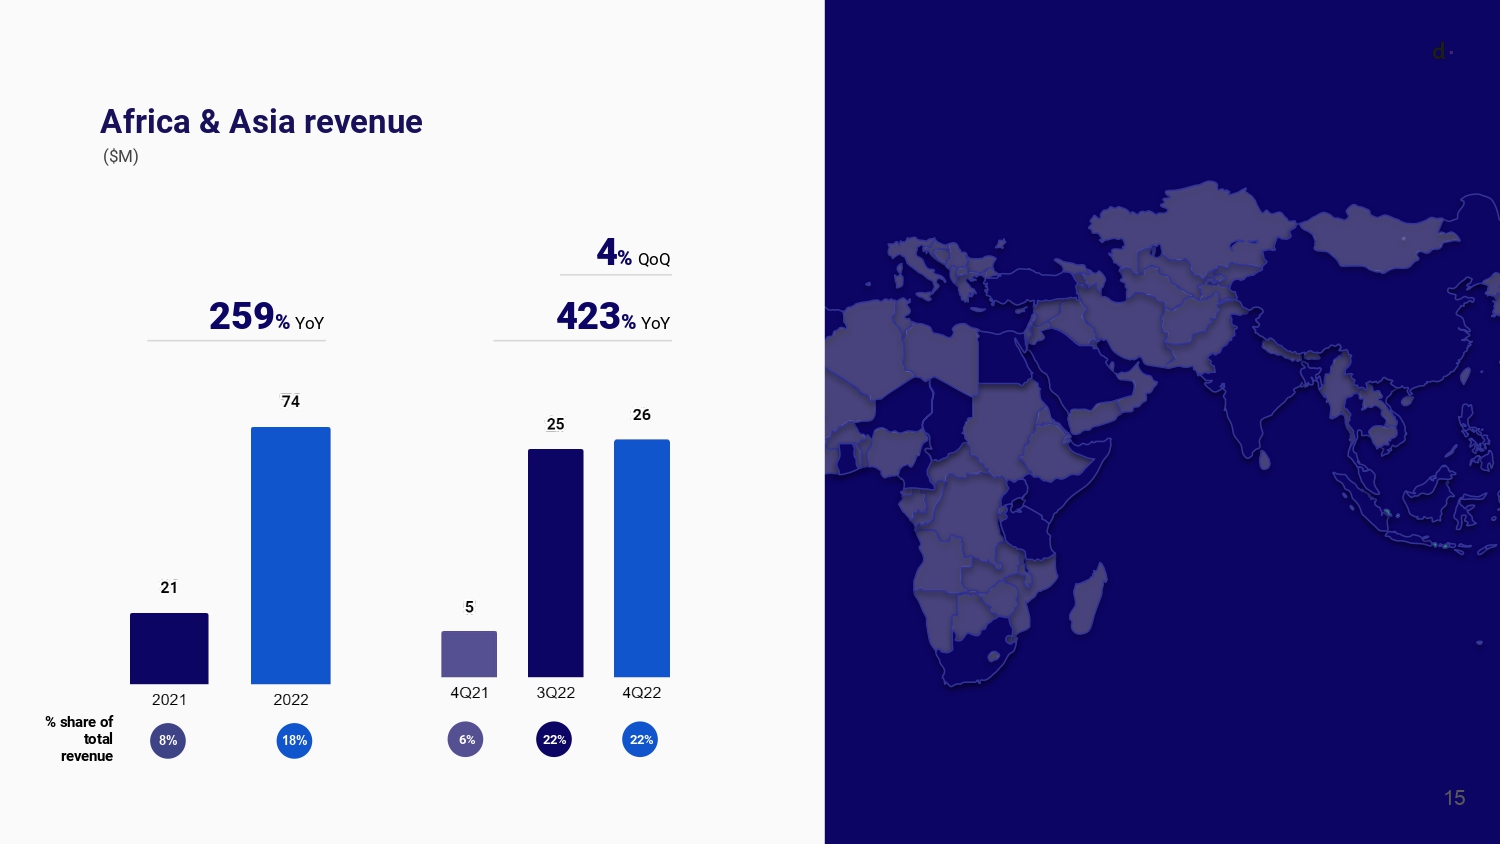
We believe we have systematically over-delivered on our initial expectations since we went public - 2022 was no exception. Despite the high comparison base from last year, our revenues grew 72% year-over-year to US$418.9 million. We delivered another year of outstanding NRR of 165% in 2022, versus our expectation for the year at 150% plus. In Q4, revenues grew 55% year-over-year. We are proud to announce that our efforts to expand outside Latin America are paying off, with revenues from Africa and Asia growing fourfold year-over-year to reach US$73.6 million or 18% of our total revenues in 2022.
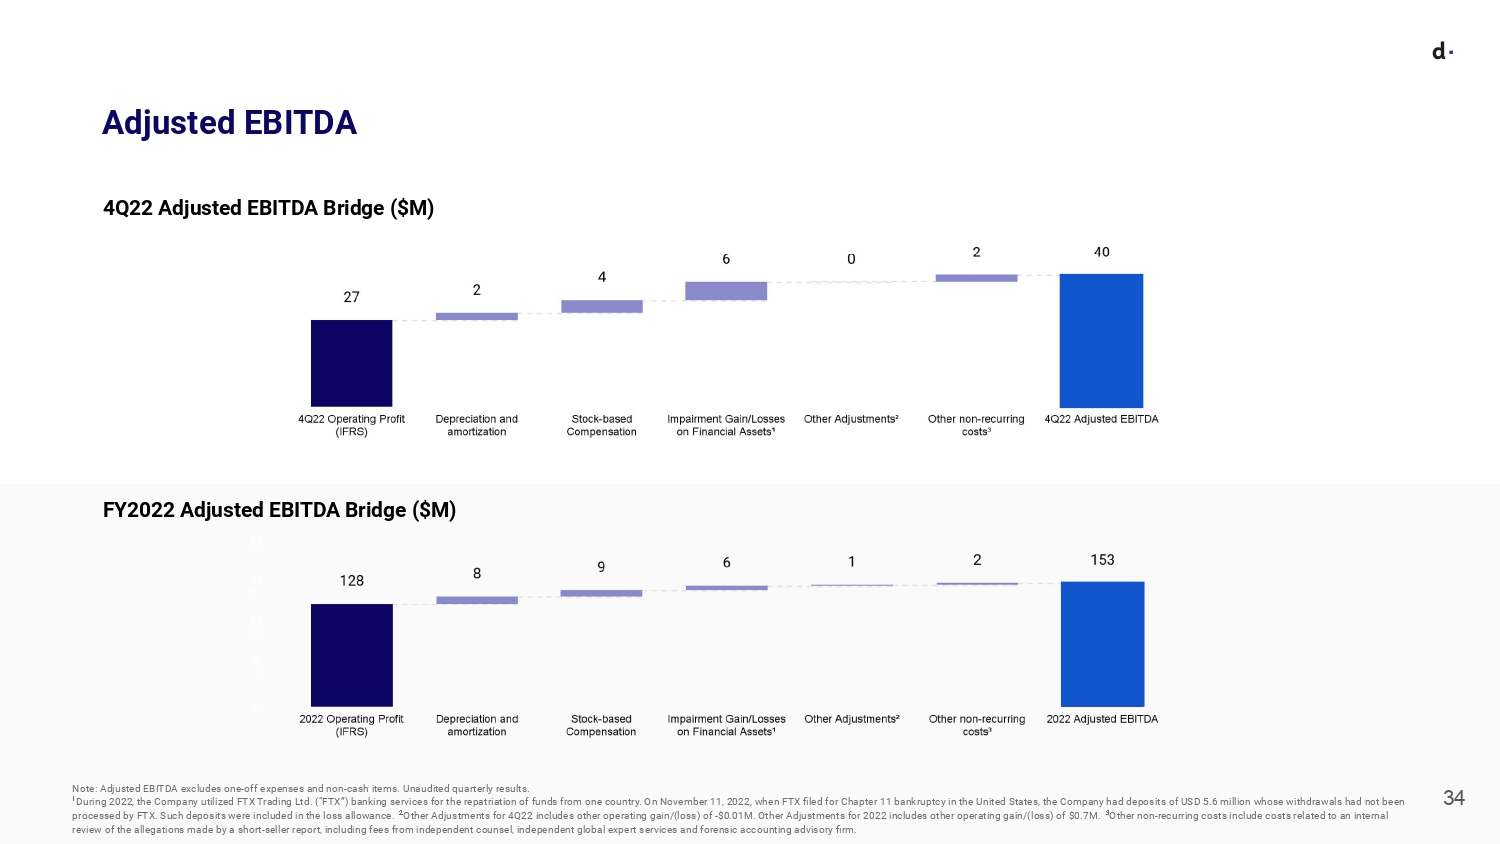
We continue to focus on growing gross profit and EBITDA dollars. During the full year 2022, gross profit increased to US$202.2 million, up by 55% year-over-year and Adjusted EBITDA was up by 54% year-over-year to US$153.1 million. In Q4, our gross profit reached $55.1 million, up 42% year-over-year, and our Adjusted EBITDA was US$40.4 million, up 39% year-over-year.
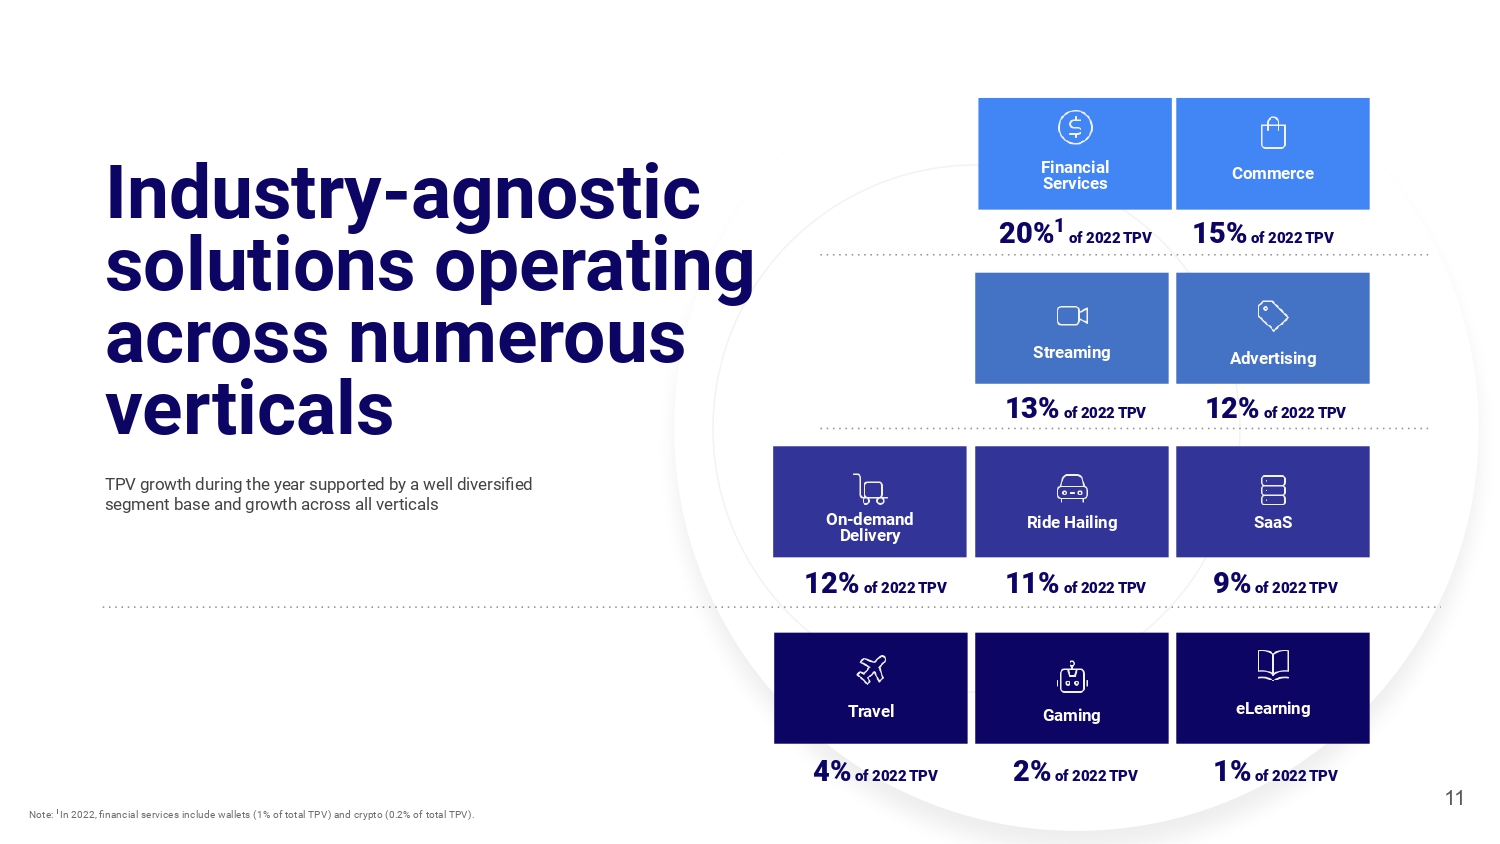
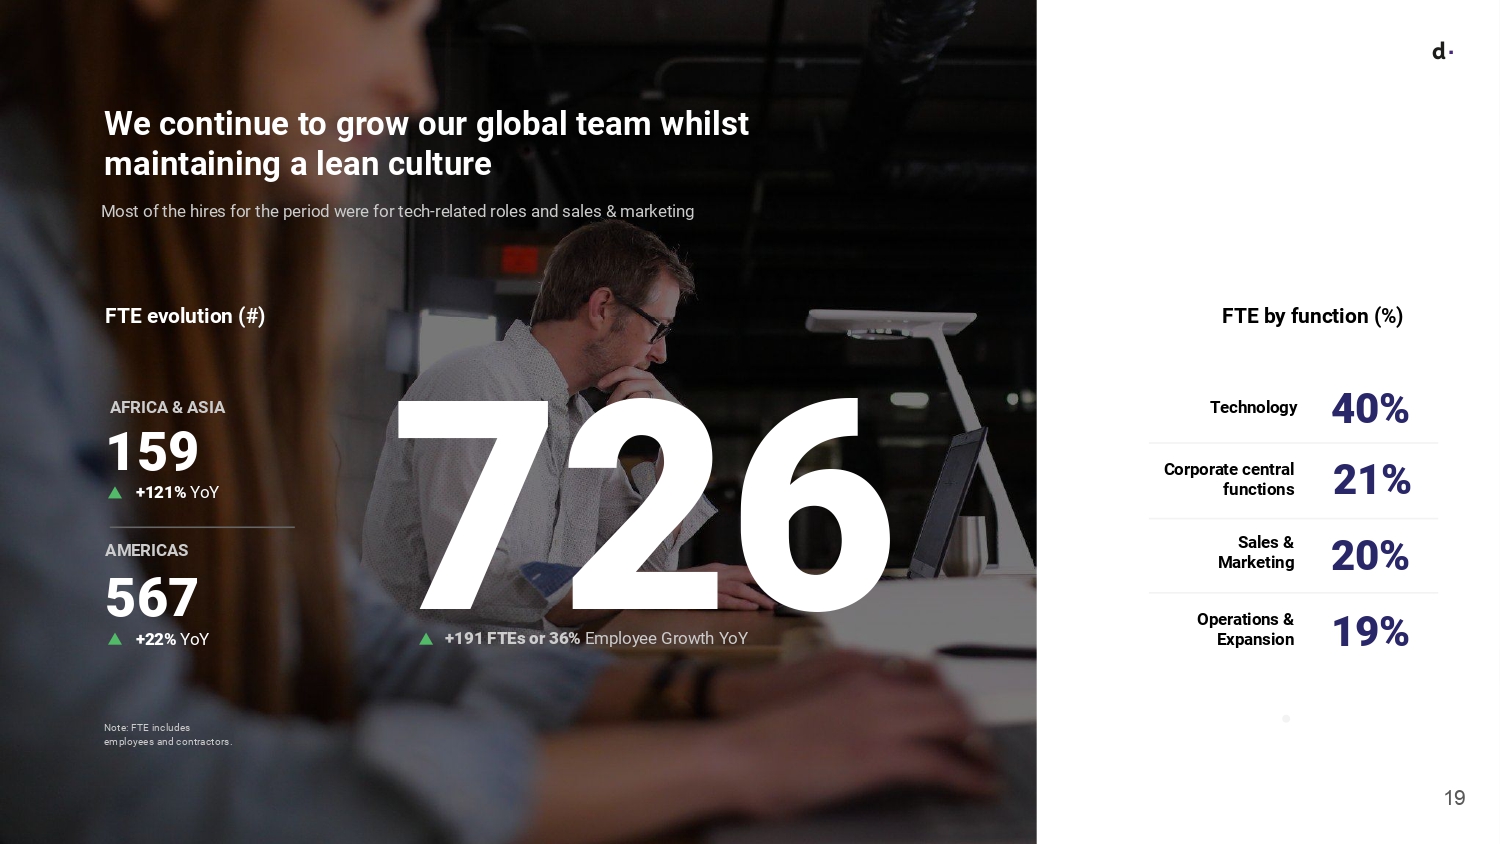
We were able to achieve these outstanding results thanks to our 726 team members who continuously strive for excellence, as well as our discipline and focus on delivering sustainable and profitable growth. In addition, our business continues to be supported by diversification across verticals, regions, and products which further increases our value proposition and strengthens our client relationships.
As we look at 2023, we are very excited about the opportunities we foresee. We believe that our pipeline is as strong as ever. Our customer base continues to have global ambitions and expects to grow in emerging markets, where growth normally outpaces developed markets. We will continue to focus on delivering the best payments solutions to our customers while maximizing absolute dollar profit growth as we believe this will create the most valuable business in the long run. Our scalable business model and strong balance sheet give us confidence that we are uniquely positioned to fulfill our long-term vision of building the best financial infrastructure for our merchants across emerging markets.” Sebastian Kanovich.
Fourth quarter and full year 2022 financial highlights
The following table summarizes our key performance metrics:
|
Three Months Ended December 31 |
Twelve Months Ended December 31 |
||||
|
2022 |
2021 |
% change |
2022 |
2021 |
% change |
Key Performance metrics |
(In millions of US$ except for %) |
|||||
TPV |
3,296 |
1,856 |
78% |
10,567 |
6,049 |
75% |
Revenue |
118.4 |
76.3 |
55% |
418.9 |
244.1 |
72% |
Gross Profit |
55.1 |
38.9 |
42% |
202.2 |
130.4 |
55% |
Gross Profit margin |
47% |
51% |
-5p.p |
48% |
53% |
-5p.p |
Adjusted EBITDA |
40.4 |
29.1 |
39% |
153.1 |
99.2 |
54% |
Adjusted EBITDA margin |
34% |
38% |
-4p.p |
37% |
41% |
-4p.p |
Profit |
19.4 |
23.5 |
-18% |
108.7 |
77.9 |
40% |
Profit margin |
16% |
31% |
-15p.p |
26% |
32% |
-6p.p |
Fourth quarter and full year 2022 business highlights
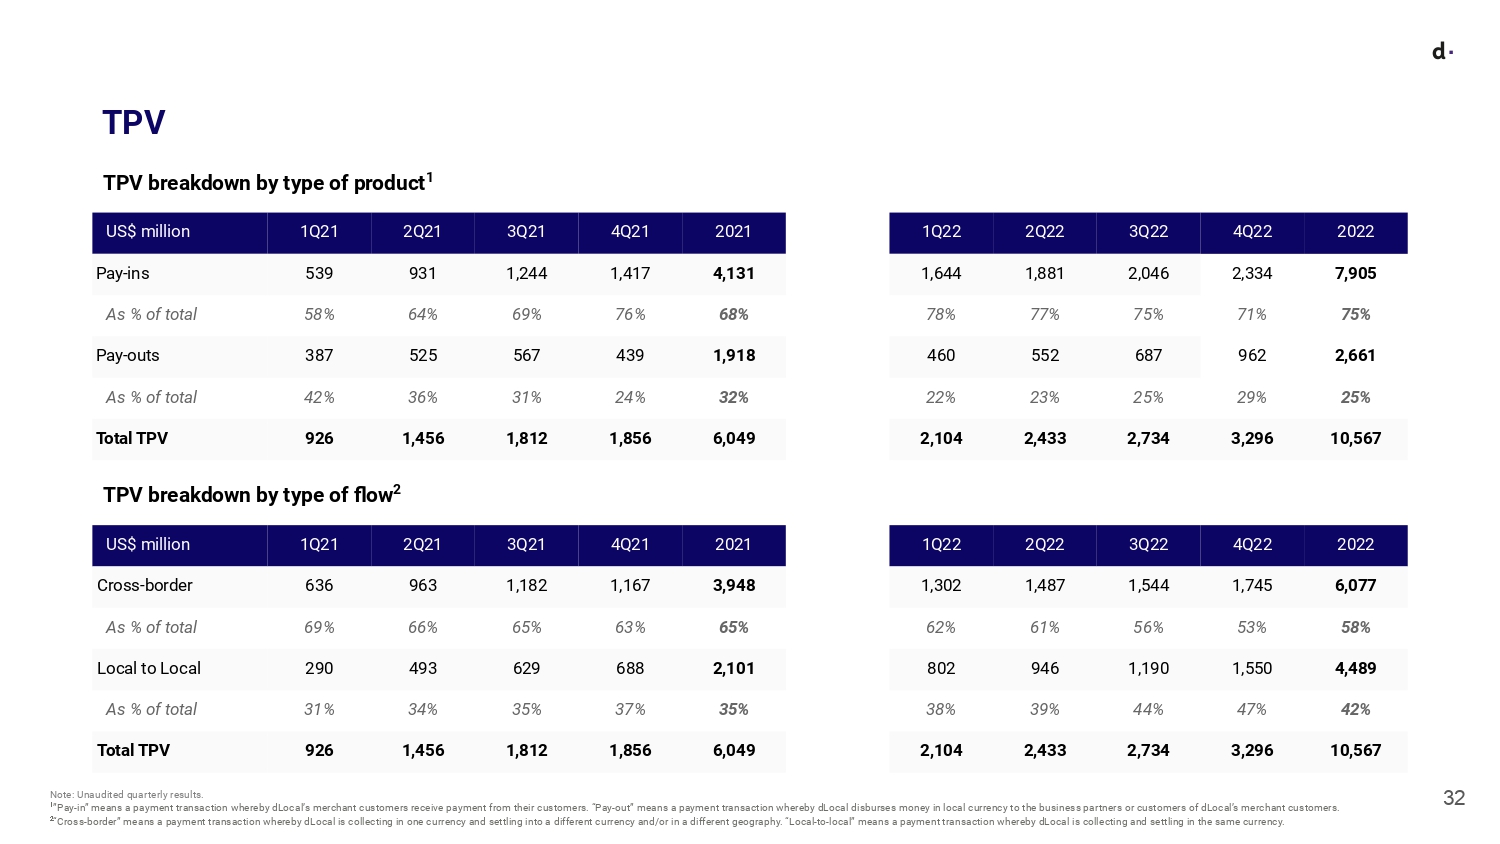
The table below presents a breakdown of dLocal’s TPV by product and type of flow:
In millions of US$ except for % |
Three months ended December 31 |
Twelve months ended December 31 |
||||||
|
2022 |
% share |
2021 |
% share |
2022 |
% share |
2021 |
% share |
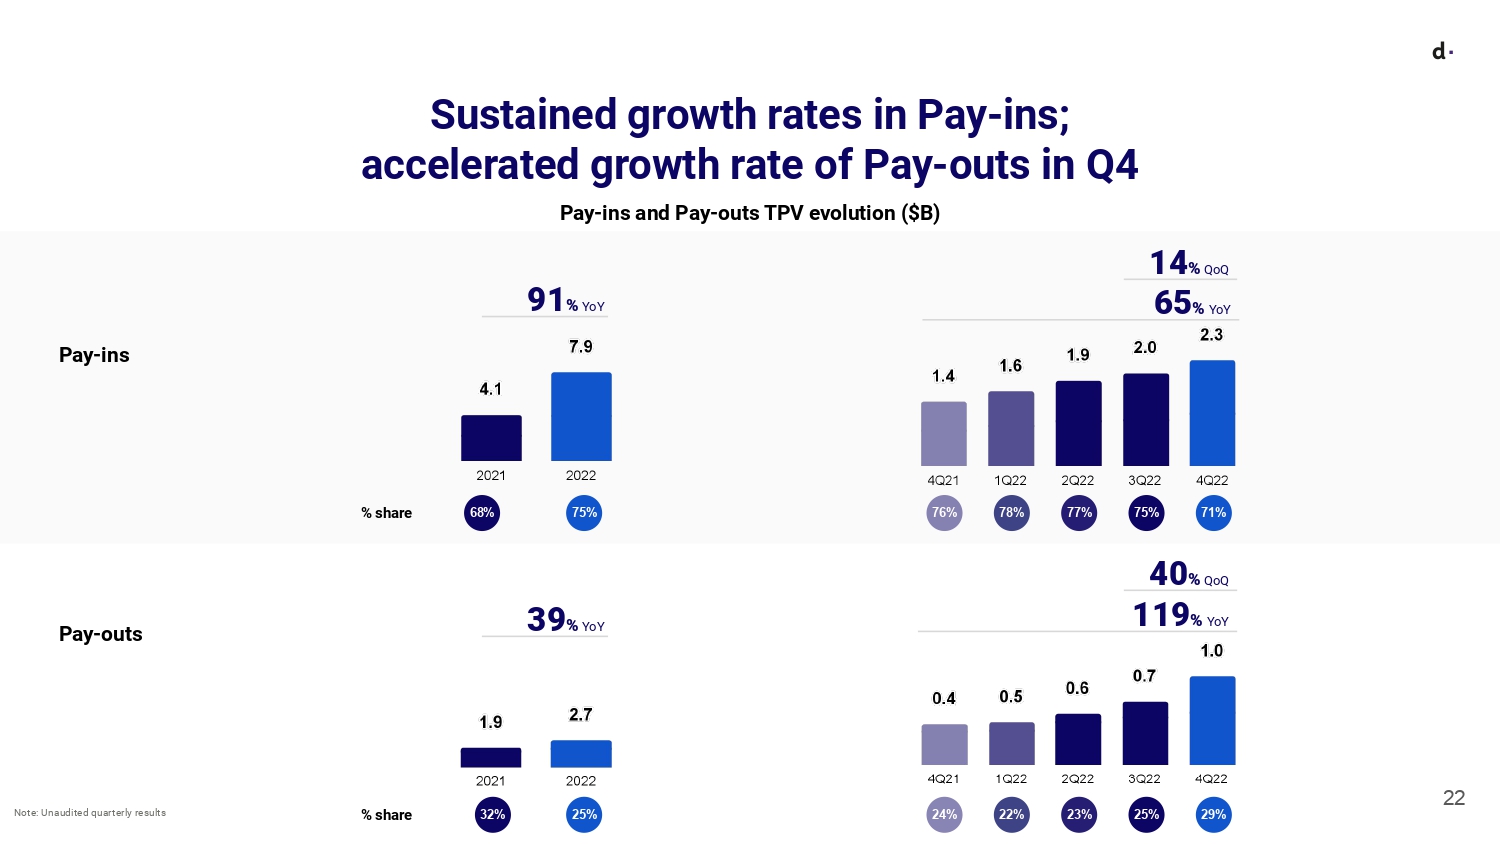
Pay-ins |
2,334 |
71% |
1,417 |
76% |
7,905 |
75% |
4,131 |
68% |
Pay-outs |
962 |
29% |
439 |
24% |
2,661 |
25% |
1,918 |
32% |
Total TPV |
3,296 |
100% |
1,856 |
100% |
10,567 |
100% |
6,049 |
100% |
In millions of US$ except for % |
Three months ended December 31 |
Twelve months ended December 31 |
||||||
|
2022 |
% share |
2021 |
% share |
2022 |
% share |
2021 |
% share |
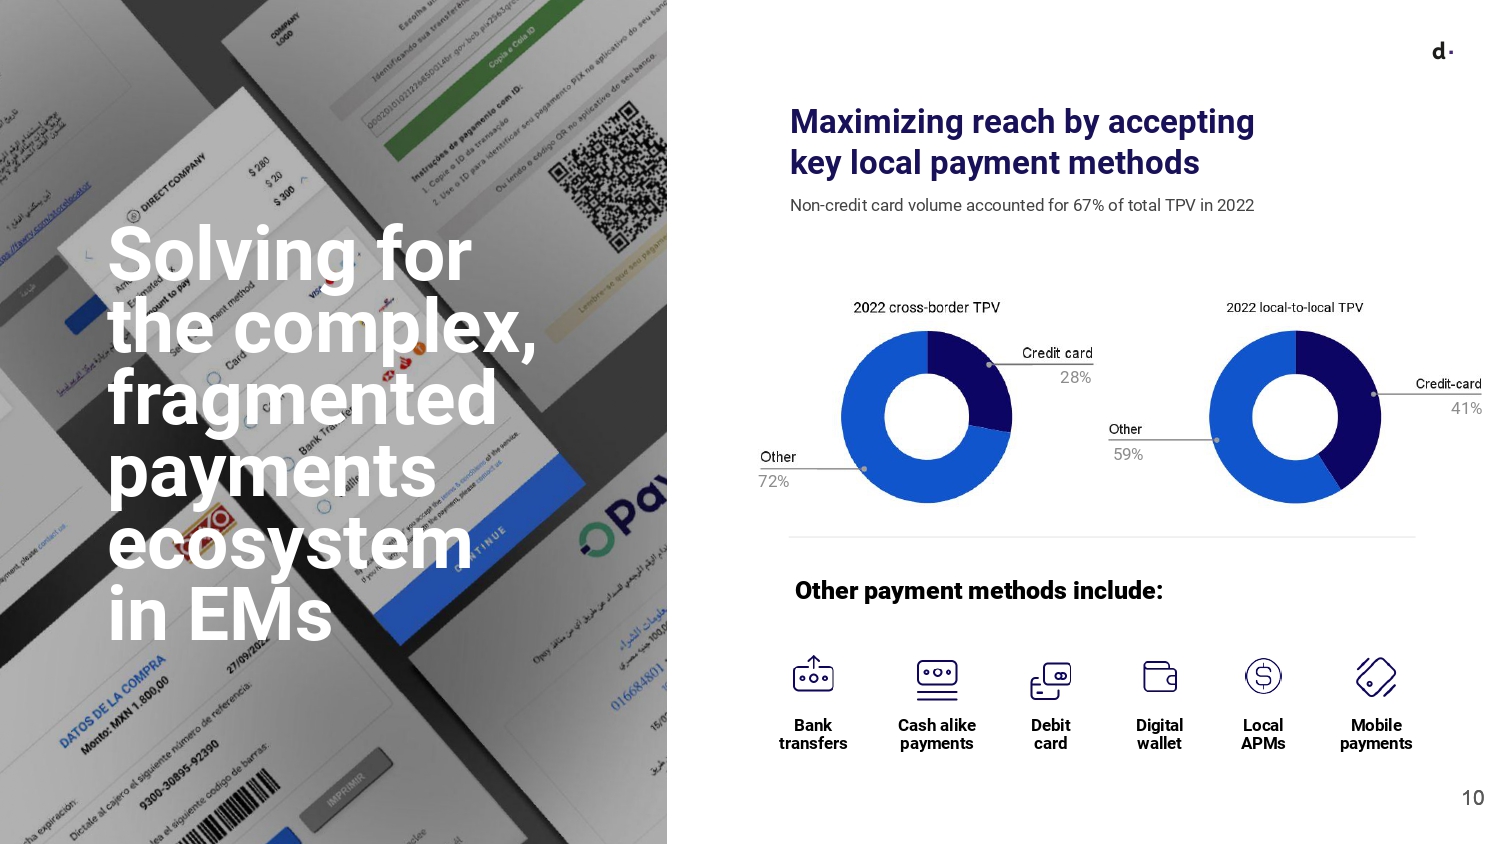
Cross-border |
1,745 |
53% |
1,167 |
63% |
6,077 |
58% |
3,948 |
65% |
Local-to-local |
1,550 |
47% |
688 |
37% |
4,489 |
42% |
2,101 |
35% |
Total TPV |
3,296 |
100% |
1,856 |
100% |
10,567 |
100% |
6,049 |
100% |
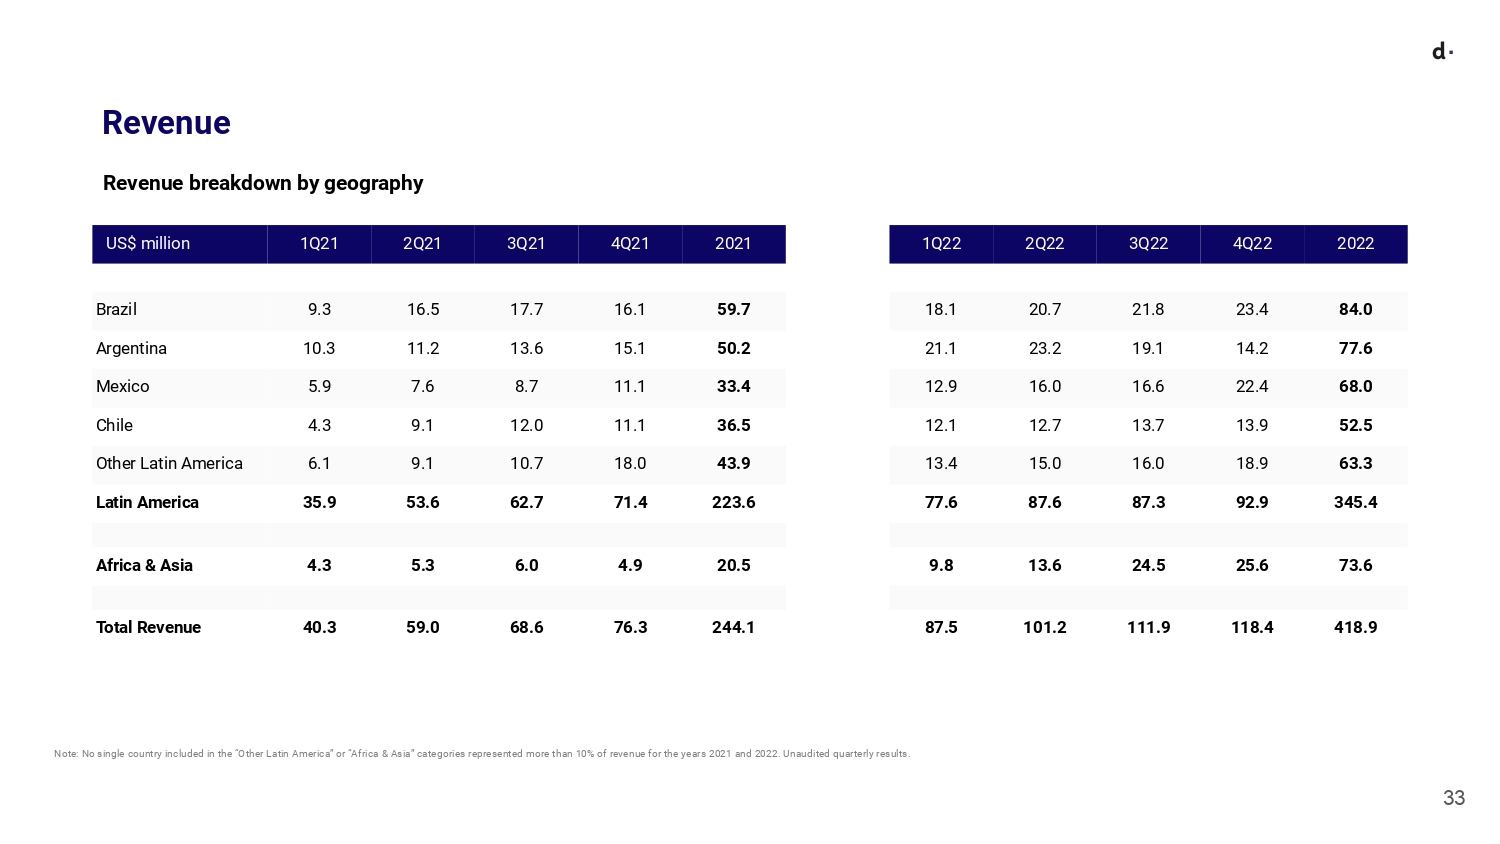
The table below presents a breakdown of dLocal’s revenue by geography:
In millions of US$ except for % |
Three months ended December 31 |
Twelve months ended December 31 |
||||||
|
2022 |
% share |
2021 |
% share |
2022 |
% share |
2021 |
% share |
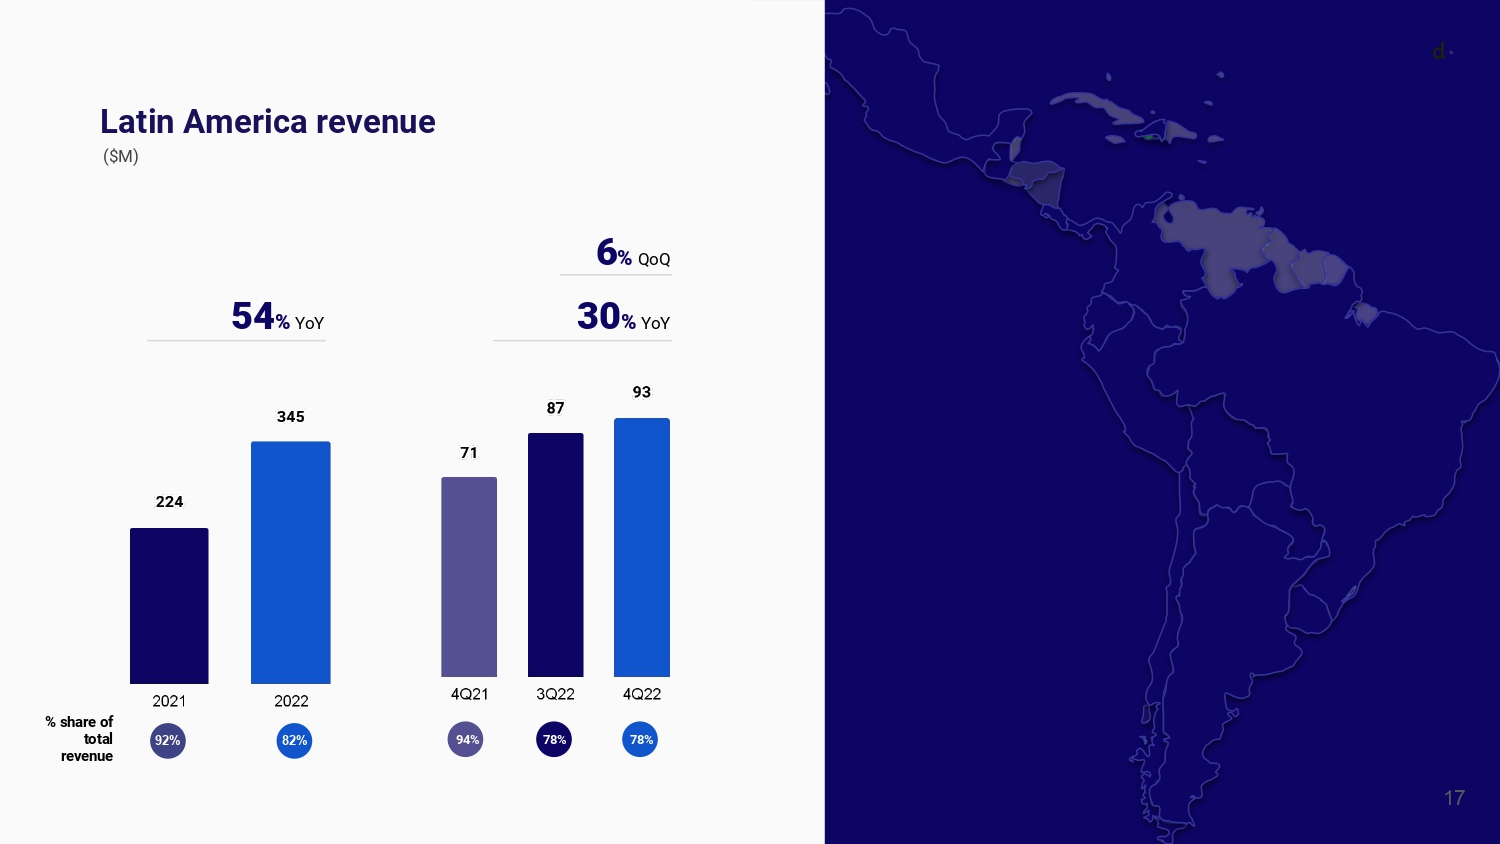
Latin America |
92.9 |
78% |
71.4 |
94% |
345.4 |
82% |
223.6 |
92% |
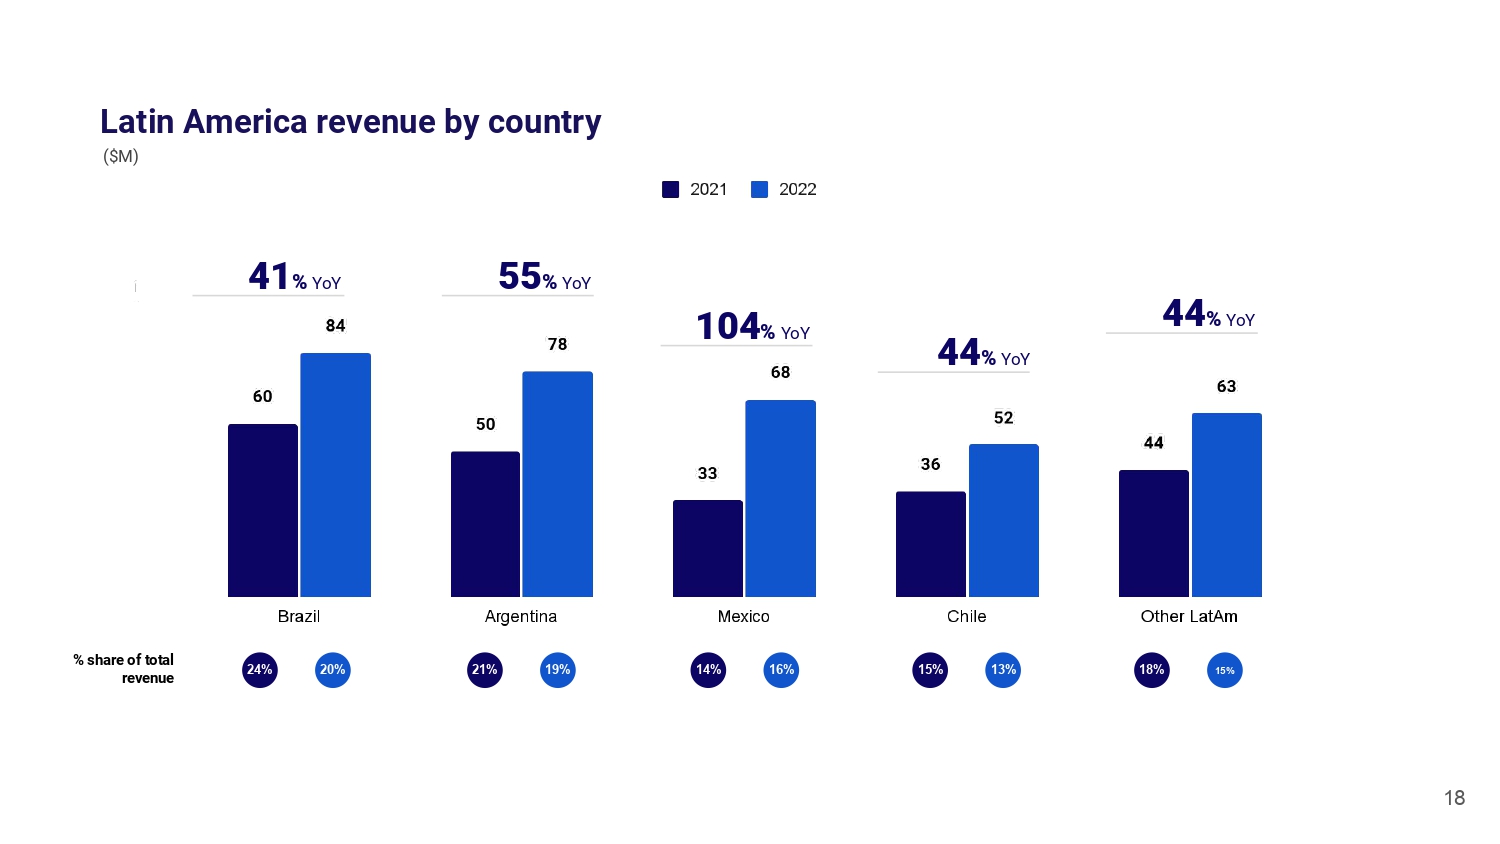
Brazil |
23.4 |
20% |
16.1 |
21% |
84.0 |
20% |
59.7 |
24% |
Argentina |
14.2 |
12% |
15.1 |
20% |
77.6 |
19% |
50.2 |
21% |
Mexico |
22.4 |
19% |
11.1 |
15% |
68.0 |
16% |
33.4 |
14% |
Chile |
13.9 |
12% |
11.1 |
15% |
52.5 |
13% |
36.5 |
15% |
Other Latin America |
18.9 |
16% |
18.0 |
24% |
63.3 |
15% |
43.9 |
18% |
Africa & Asia |
25.6 |
22% |
4.9 |
6% |
73.6 |
18% |
20.5 |
8% |
Total Revenue |
118.4 |
100% |
76.3 |
100% |
418.9 |
100% |
244.1 |
100% |
Note: No single country included in the “Other Latin America” or “Africa & Asia” categories represented more than 10% of revenue for the years 2021 and 2022.
Special note regarding Adjusted EBITDA and Adjusted EBITDA Margin
dLocal has only one operating segment. dLocal measures its operating segment’s performance by Revenues, Adjusted EBITDA and Adjusted EBITDA Margin, and uses these metrics to make decisions about allocating resources.
Adjusted EBITDA as used by dLocal is defined as the profit from operations before financing and taxation for the year or period, as applicable, before depreciation of property, plant and equipment, amortization of right-of-use assets and intangible assets, and further excluding the changes in fair value of financial assets and derivative instruments carried at fair value through profit or loss, impairment gains/(losses) on financial assets, transaction costs, share-based payment non-cash charges, secondary offering expenses, and inflation adjustment. dLocal defines Adjusted EBITDA Margin as the Adjusted EBITDA divided by consolidated revenues.
Although Adjusted EBITDA and Adjusted EBITDA Margin may be commonly viewed as non-IFRS measures in other contexts, pursuant to IFRS 8, (“Operating Segments”), Adjusted EBITDA and Adjusted EBITDA Margin are treated by dLocal as IFRS measures based on the manner in which dLocal utilizes these measures. Nevertheless, dLocal’s Adjusted EBITDA and Adjusted EBITDA Margin metrics should not be viewed in isolation or as a substitute for net income for the periods presented under IFRS. dLocal also believes that its Adjusted EBITDA and Adjusted EBITDA Margin metrics are useful metrics used by analysts and investors, although these measures are not explicitly defined under IFRS. Additionally, the way dLocal calculates operating segment’s performance measures may be different from the calculations used by other entities, including competitors, and therefore, dLocal’s performance measures may not be comparable to those of other entities.
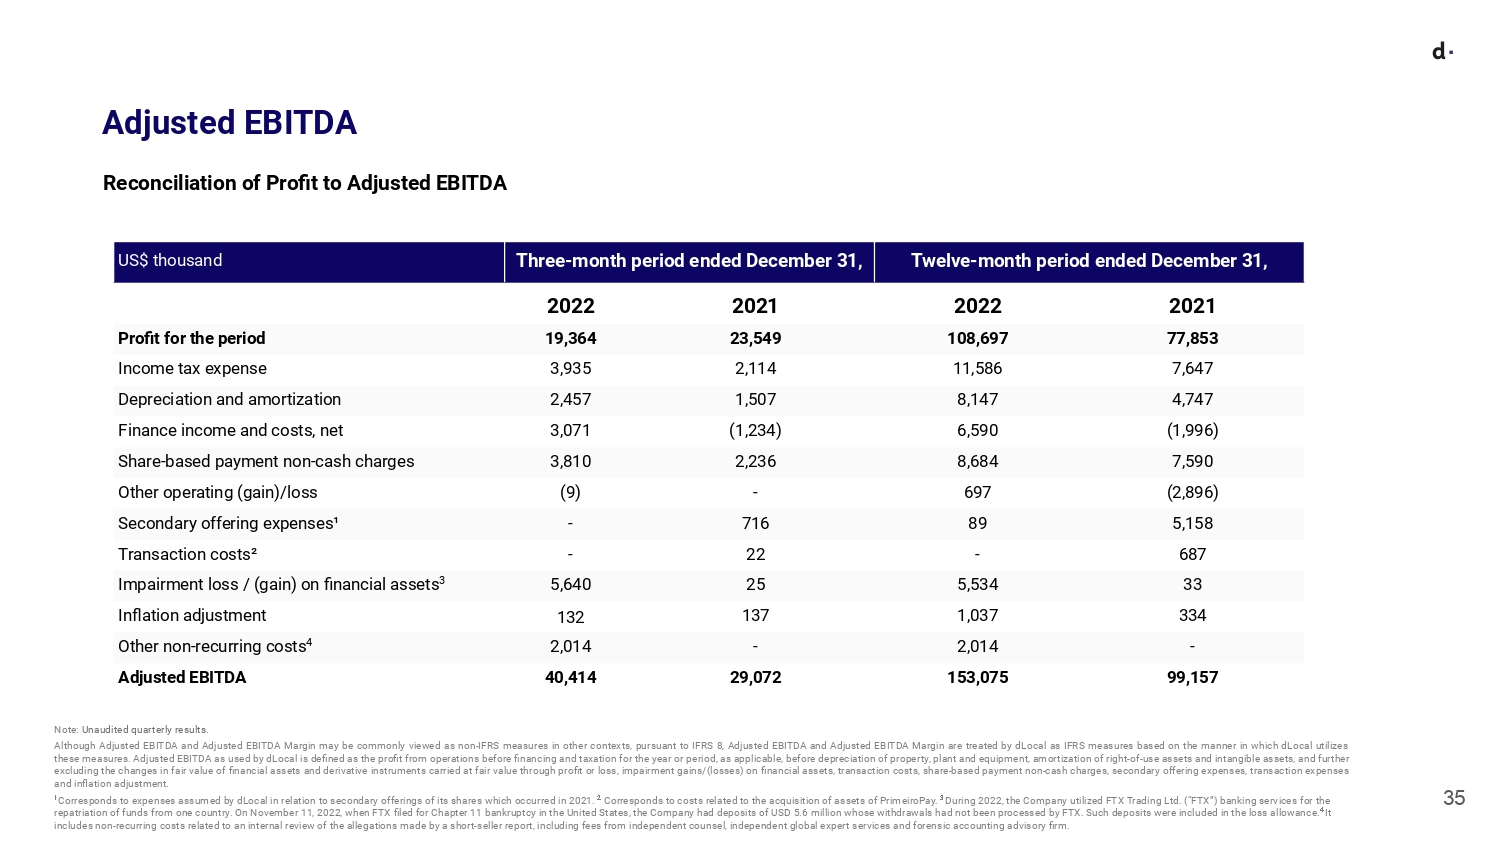
The table below presents a reconciliation of dLocal’s Adjusted EBITDA and Adjusted EBITDA Margin to net income:
US$ in thousands |
Three-month period ended |
Twelve-month period ended |
||
|
2022 |
2021 |
2022 |
2021 |
Profit for the period1 |
19,364 |
23,549 |
108,697 |
77,853 |
Income tax expense |
3,935 |
2,114 |
11,586 |
7,647 |
Depreciation and amortization |
2,457 |
1,507 |
8,147 |
4,747 |
Finance income and costs, net |
3,071 |
(1,234) |
6,590 |
(1,996) |
Share-based payment non-cash charges |
3,810 |
2,236 |
8,684 |
7,590 |
Other operating (gain)/loss |
(9) |
- |
697 |
(2,896) |
Secondary offering expenses2 |
- |
716 |
89 |
5,158 |
Transaction costs3 |
- |
22 |
- |
687 |
Impairment loss / (gain) on financial assets4 |
5,640 |
25 |
5,534 |
33 |
Inflation adjustment |
132 |
137 |
1,037 |
334 |
Other non-recurring costs5 |
2,014 |
- |
2,014 |
- |
Adjusted EBITDA |
40,414 |
29,072 |
153,075 |
99,157 |
Note:
1In 2022, includes a net gain of USD 14,559 related to the effective portion of the change in the spot rate of the hedged currency, which offsets a foreign exchange loss of USD 14,832 (together for a net foreign exchange loss of USD 273 included in Cost of Services). For further information refer to Notes 6(c)i, Note 11 (iii) and Note 24 Derivative financial instruments of our Financial Statements.
2Corresponds to expenses incurred by dLocal in relation to a secondary offering of its shares occurred in 2021.
3Corresponds to costs related to the acquisition of PrimeiroPay explained in Note 20 of our Financial Statements: Intangible Assets and costs related to the potential acquisition of business (whether the acquisition is completed or not).
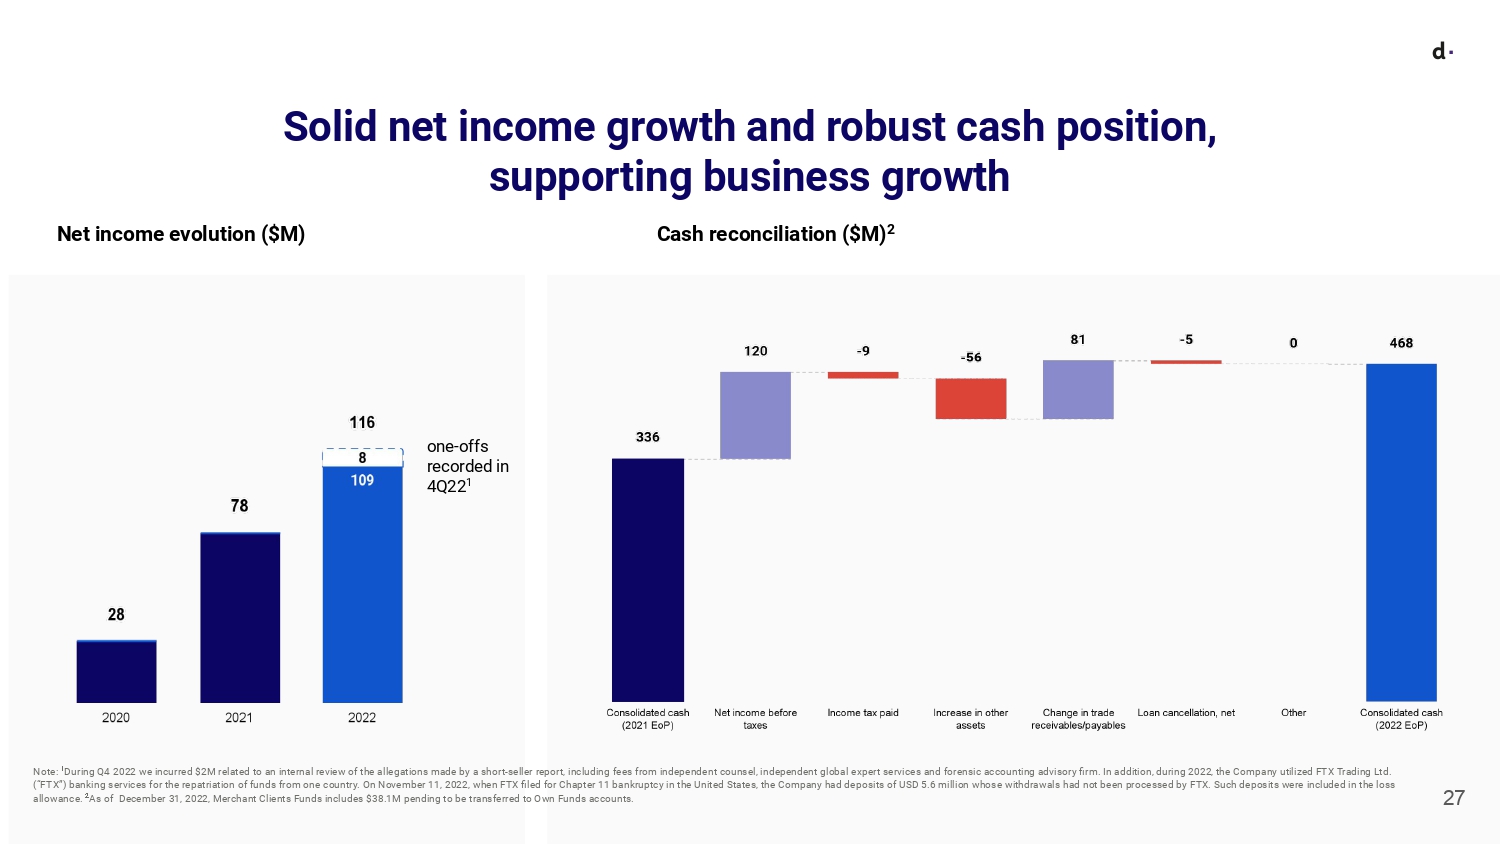
4During 2022, the Company utilized FTX Trading Ltd. (“FTX”) banking services for the repatriation of funds from one country. On November 11, 2022, when FTX filed for Chapter 11 bankruptcy in the United States, the Company had deposits of USD 5.6 million whose withdrawals had not been processed by FTX. Such deposits were included in the loss allowance.
5Includes non-recurring costs related to an internal review of the allegations made by a short-seller report, including fees from independent counsel, independent global expert services and forensic accounting advisory firm.
Earnings per share
We calculate basic earnings per share by dividing the profit attributable to owners of the group by the weighted average number of common shares issued and outstanding during the three-months and twelve-months periods ended December 31, 2022 and 2021.
Our diluted earnings per share is calculated by dividing the profit attributable to owners of the group of dLocal by the weighted average number of common shares outstanding during the period plus the weighted average number of common shares that would be issued on conversion of all dilutive potential common shares into common shares.
The following table presents the information used as a basis for the calculation of our earnings per share:
|
Three Months Ended December 31 |
Twelve Months Ended December 31 |
||
|
2022 |
2021 |
2022 |
2021 |
Profit attributable to owners of the group (U.S. Dollars) |
19,356,500 |
23,584,950 |
108,682,969 |
77,875,575 |
Weighted average number of common shares |
296,123,037 |
295,028,441 |
295,623,702 |
287,121,304 |
Adjustments for calculation of diluted earnings per share |
17,125,497 |
18,303,500 |
17,514,944 |
21,809,000 |
Weighted average number of common shares for calculating diluted earnings per share |
313,248,534 |
313,331,941 |
313,138,646 |
308,930,304 |
Basic earnings per share |
0.07 |
0.08 |
0.37 |
0.27 |
Diluted earnings per share |
0.06 |
0.08 |
0.35 |
0.25 |
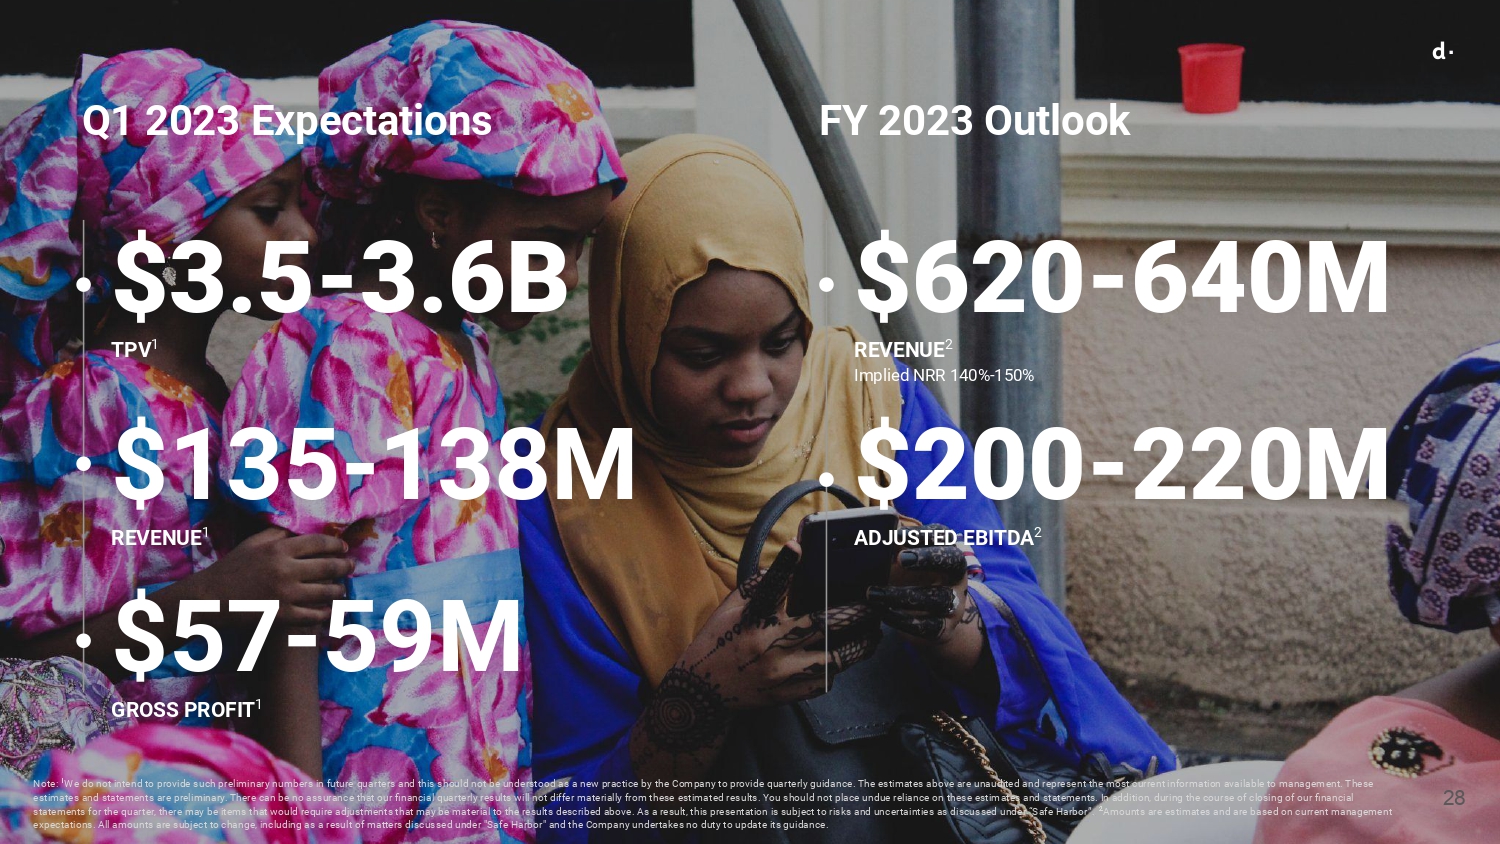
Q1 2023 expectations & full year 2023 outlook
Preliminary estimates of operating results for the three months ended March 31, 2023
We do not intend to provide such preliminary numbers in future quarters, and this should not be understood as a new practice by the Company to provide quarterly guidance.
Outlook full year 2023
Outlook amounts for full year 2023 are estimates and are based on current management expectations. Amounts are subject to change, and we undertake no duty to update this outlook.
Cautionary Statement Regarding Preliminary Estimated Results:
This unaudited preliminary consolidated financial information for the three months ended March 31, 2023, is based upon our estimates and subject to completion of our quarter end financial results. Moreover, this preliminary financial information has been prepared solely on the basis of currently available information by, and is the responsibility of, management. This preliminary financial information is not a comprehensive statement of our consolidated financial results for the three month period ended March 31, 2023. Price Waterhouse & Co. S.R.L has not audited, reviewed, compiled or applied agreed-upon procedures with respect to the preliminary financial information. Accordingly, Price Waterhouse & Co. S.R.L. does not express an opinion or any other form of assurance with respect thereto.
Preliminary estimated results for the three months ended March 31, 2023 are preliminary, unaudited and subject to completion. They reflect our management’s current views and may change as a result of our management’s review of results and other factors, including a wide variety of significant uncertainties. Such preliminary results for the three months ended March 31, 2023 are subject to the finalization and closing of our accounting books and records (which have yet to be performed), and should not be viewed as a substitute for full quarterly financial statements prepared in accordance with IFRS. We caution you that these preliminary estimated results for the three months ended March 31, 2023 are not guarantees of future performance or outcomes and that actual results may differ materially from those described above.
Actual results may differ from those described above as described under “Special Note Regarding Forward-Looking Statements.”
This press release does not contain sufficient information to constitute an interim financial report as defined in International Accounting Standards 34, “Interim Financial Reporting” nor a financial statement as defined by International Accounting Standards 1 “Presentation of Financial Statements”. The quarterly financial information in this press release has not been audited, whereas the annual results for the year ended December 31, 2022 and as of December 31, 2021 are audited.
Conference call and webcast
dLocal’s management team will host a conference call and audio webcast on April 5, 2023 at 8:00 a.m. Eastern Time. Please click here to pre-register for the conference call and obtain your dial in number and passcode.
The live conference call can be accessed via audio webcast at the investor relations section of dLocal’s website, at https://investor.dlocal.com/. An archive of the webcast will be available for a year following the conclusion of the conference call. The investor presentation will also be filed on EDGAR at www.sec.gov.
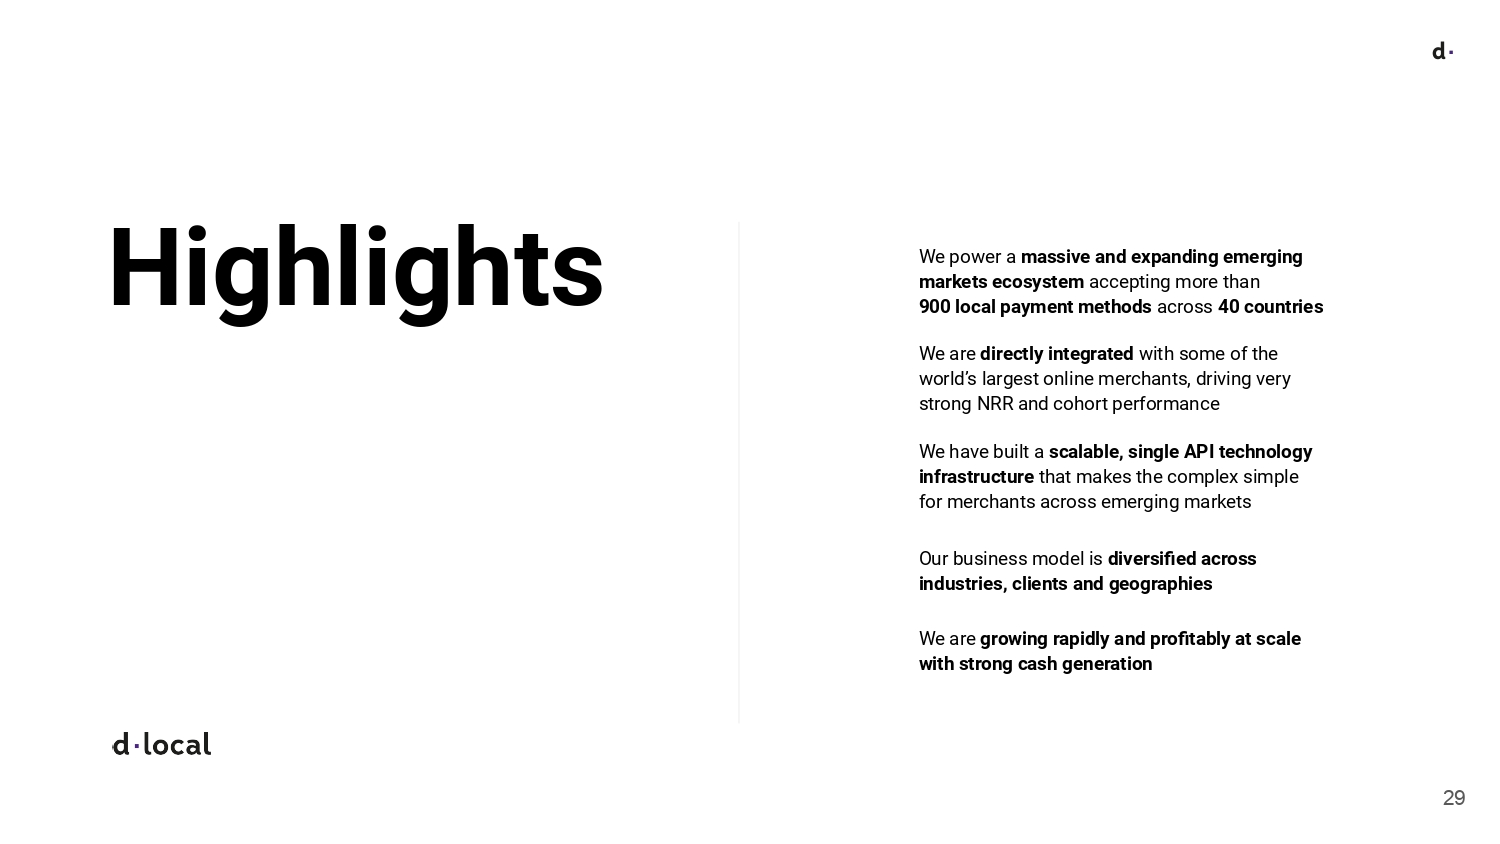
About dLocal
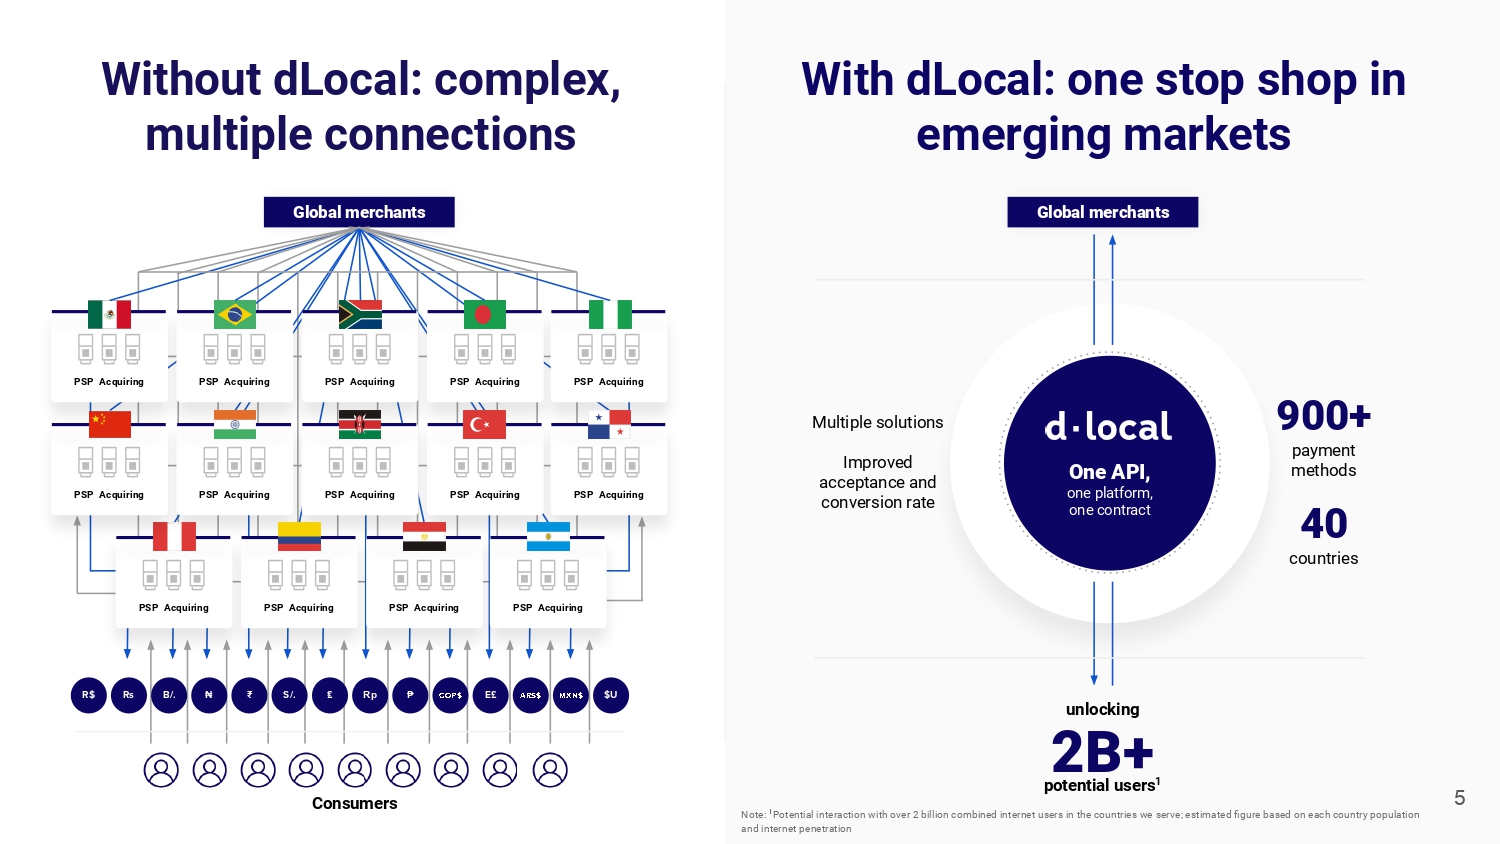
dLocal powers local payments in emerging markets, connecting global enterprise merchants with billions of emerging market consumers in 40 countries across APAC, the Middle East, Latin America, and Africa. Through the “One dLocal” platform (one direct API, one platform, and one contract), global companies can accept payments, send pay-outs and settle funds globally without the need to manage separate pay-in and pay-out processors, set up numerous local entities, and integrate multiple acquirers and payment methods in each market.
Definition of selected operational metrics
“API”means application programming interface, which is a general term for programming techniques that are available for software developers when they integrate with a particular service or application. In the payments industry, APIs are usually provided by any party participating in the money flow (such as payment gateways, processors, and service providers) to facilitate the money transfer process.
“Cross-border”means a payment transaction whereby dLocal is collecting in one currency and settling into a different currency and/or in a different geography.
“Enterprise Global Merchants” means merchants with at least US$6 million of annual TPV processed through our platform.
“Local payment methods” refers to any payment method that is processed in the country where the end user of the merchant sending or receiving payments is located, which include credit and debit cards, cash payments, bank transfers, mobile money, and digital wallets.
“Local-to-local” means a payment transaction whereby dLocal is collecting and settling in the same currency.
“Net Revenue Retention Rate” or “NRR” is a U.S. dollar-based measure of retention and growth of dLocal’s merchants. NRR is calculated for a period or year by dividing the Current Period/Year Revenue by the Prior Period/Year Revenue. The Prior Period/Year Revenue is the revenue billed by us to all our customers in the prior period. The Current Period/Year Revenue is the revenue billed by us in the current period to the same customers included in the Prior Period/Year Revenue. Current Period/Year Revenue includes revenues from any upselling and cross-selling across products, geographies, and payment methods to such merchant customers, and is net of any contractions or attrition, in respect of such merchant customers, and excludes revenue from new customers on-boarded in the preceding twelve months. As most of dLocal revenues come from existing merchants, the NRR rate is a key metric used by management, and we believe it is useful for investors in order to assess our retention of existing customers and growth in revenues from our existing customer base.
“Pay-in”means a payment transaction whereby dLocal’s merchant customers receive payment from their customers.
“Pay-out”means a payment transaction whereby dLocal disburses money in local currency to the business partners or customers of dLocal’s merchant customers.
“Revenue from New Merchants” means the revenue billed by us to merchant customers that we did not bill revenues in the same quarter (or period) of the prior year.
“Revenue from Existing Merchants” means the revenue billed by us in the last twelve months to the merchant customers that we billed revenue in the same quarter (or period) of the prior year.
“TPV” dLocal presents total payment volume, or TPV, which is an operating metric of the aggregate value of all payments successfully processed through dLocal’s payments platform. Because revenue depends significantly on the total value of transactions processed through the dLocal platform, management believes that TPV is an indicator of the success of dLocal’s global merchants, the satisfaction of their end users, and the scale and growth of dLocal’s business
Forward-looking statements
This press release contains certain forward-looking statements. These forward-looking statements convey dLocal’s current expectations or forecasts of future events. Forward-looking statements regarding dLocal involve known and unknown risks, uncertainties and other factors that may cause dLocal’s actual results, performance or achievements to be materially different from any future results, performances or achievements expressed or implied by the forward-looking statements. Certain of these risks and uncertainties are described in the “Risk Factors,” “Forward-Looking Statements” and “Cautionary Statement Regarding Forward-Looking Statements” sections of dLocal’s filings with the U.S. Securities and Exchange Commission. Unless required by law, dLocal undertakes no obligation to publicly update or revise any forward-looking statements to reflect circumstances or events after the date hereof.
dLocal Limited
Certain financial information
Consolidated Condensed Statements of Comprehensive Income for the three-month and twelve-month period ended December 31, 2022 and 2021
(In thousands of U.S. dollars, except per share amounts)
|
Three months ended December 31 |
Twelve months ended December 31 |
||
|
2022 |
2021 |
2022 |
2021 |
Continuing operations |
|
|
|
|
Revenues |
118,428 |
76,257 |
418,925 |
244,120 |
Cost of services |
(63,326) |
(37,316) |
(216,758) |
(113,677) |
Gross profit |
55,102 |
38,941 |
202,167 |
130,443 |
|
|
|
|
|
Technology and development expenses |
(1,607) |
(1,154) |
(6,348) |
(3,386) |
Sales and marketing expenses |
(3,891) |
(2,492) |
(13,335) |
(5,916) |
General and administrative expenses |
(17,471) |
(10,557) |
(48,343) |
(40,637) |
Impairment (loss)/gain on financial assets |
(5,640) |
(25) |
(5,534) |
(33) |
Other operating (loss)/gain |
9 |
(147) |
(697) |
3,367 |
Operating profit |
26,502 |
24,566 |
127,910 |
83,838 |
Finance income |
5,732 |
1,267 |
18,078 |
2,540 |
Finance costs |
(8,803) |
(33) |
(24,668) |
(544) |
Inflation adjustment |
(132) |
(137) |
(1,037) |
(334) |
Other results |
(3,203) |
1,097 |
(7,627) |
1,662 |
Profit before income tax |
23,299 |
25,663 |
120,283 |
85,500 |
Income tax expense |
(3,935) |
(2,114) |
(11,586) |
(7,647) |
Profit for the period |
19,364 |
23,549 |
108,697 |
77,853 |
|
|
|
|
|
Profit attributable to: |
|
|
|
|
Owners of the Group |
19,357 |
23,585 |
108,683 |
77,876 |
Non-controlling interest |
7 |
(36) |
14 |
(23) |
Profit for the period |
19,364 |
23,549 |
108,697 |
77,853 |
|
|
|
|
|
Earnings per share (in USD) |
|
|
|
|
Basic Earnings per share |
0.07 |
0.08 |
0.37 |
0.27 |
Diluted Earnings per share |
0.06 |
0.08 |
0.35 |
0.25 |
|
|
|
|
|
Other comprehensive income |
|
|
|
|
Items that may be reclassified to profit or loss: |
|
|
|
|
Exchange difference on translation on foreign operations |
508 |
(375) |
20 |
102 |
Other comprehensive income for the period, net of tax |
508 |
(375) |
20 |
102 |
Total comprehensive income for the period, net of tax |
19,872 |
23,173 |
108,717 |
77,955 |
|
|
|
|
|
Total comprehensive income for the period |
|
|
|
|
Owners of the Group |
19,870 |
23,209 |
108,708 |
77,969 |
Non-controlling interest |
2 |
(36) |
9 |
(14) |
Total comprehensive income for the period |
19,872 |
23,173 |
108,717 |
77,955 |
dLocal Limited
Certain financial information
Consolidated Condensed Statements of Financial Position as of December 31, 2022 and December 31, 2021
(In thousands of U.S. dollars, except per share amounts)
|
Dec 31, 2022 |
Dec 31, 2021 |
ASSETS |
|
|
Current Assets |
|
|
Cash and cash equivalents |
468,092 |
336,197 |
Financial assets at fair value through profit or loss |
1,295 |
1,004 |
Trade and other receivables |
240,446 |
190,966 |
Derivative financial instruments |
1,206 |
0 |
Other assets |
56,789 |
1,339 |
Total Current Assets |
767,828 |
529,506 |
|
|
|
Non-Current Assets |
|
|
Deferred tax assets |
362 |
133 |
Property, plant and equipment |
2,734 |
2,485 |
Right-of-use assets |
3,934 |
3,915 |
Intangible assets |
51,443 |
46,969 |
Total Non-Current Assets |
58,473 |
53,502 |
TOTAL ASSETS |
826,301 |
583,008 |
|
|
|
LIABILITIES |
|
|
Current Liabilities |
|
|
Trade and other payables |
407,874 |
277,160 |
Lease liabilities |
686 |
502 |
Tax liabilities |
11,695 |
13,126 |
Derivative financial instruments |
544 |
221 |
Borrowings |
0 |
5,014 |
Provisions |
1,473 |
1,710 |
Contingent considerations liability |
0 |
665 |
Total Current Liabilities |
422,272 |
298,398 |
|
|
|
Non-Current Liabilities |
|
|
Deferred tax liabilities |
1,016 |
883 |
Lease liabilities |
3,393 |
3,426 |
Total Non-Current Liabilities |
4,409 |
4,309 |
TOTAL LIABILITIES |
426,681 |
302,707 |
|
|
|
EQUITY |
|
|
Share Capital |
592 |
590 |
Share Premium |
164,307 |
157,151 |
Capital Reserve |
16,185 |
12,741 |
Other Reserves |
(1,448) |
(30) |
Retained earnings |
219,993 |
109,867 |
Total Equity Attributable to owners of the Group |
399,629 |
280,319 |
Non-controlling interest |
(9) |
(18) |
TOTAL EQUITY |
399,620 |
280,301 |
dLocal was incorporated on February 10, 2021, as a Cayman Islands exempted company with limited liability, duly registered with the Cayman Islands Registrar of Companies. The contribution of dLocal Group Limited (a limited liability company incorporated in Malta, the former holding entity or “dLocal Malta”) shares to dLocal has been finalized as of April 14, 2021. Until the contribution of dLocal Malta shares to it, dLocal had not commenced operations, consequently the historical information previous to that date presented in here corresponds to dLocal Malta, our predecessor. This reorganization was done, among other things, to facilitate the initial public offering of the Group. dLocal had no prior assets, holdings or operations.
Investor Relations Contact:
investor@dlocal.com
Media Contact:
marketing@dlocal.com
Exhibit 99.2


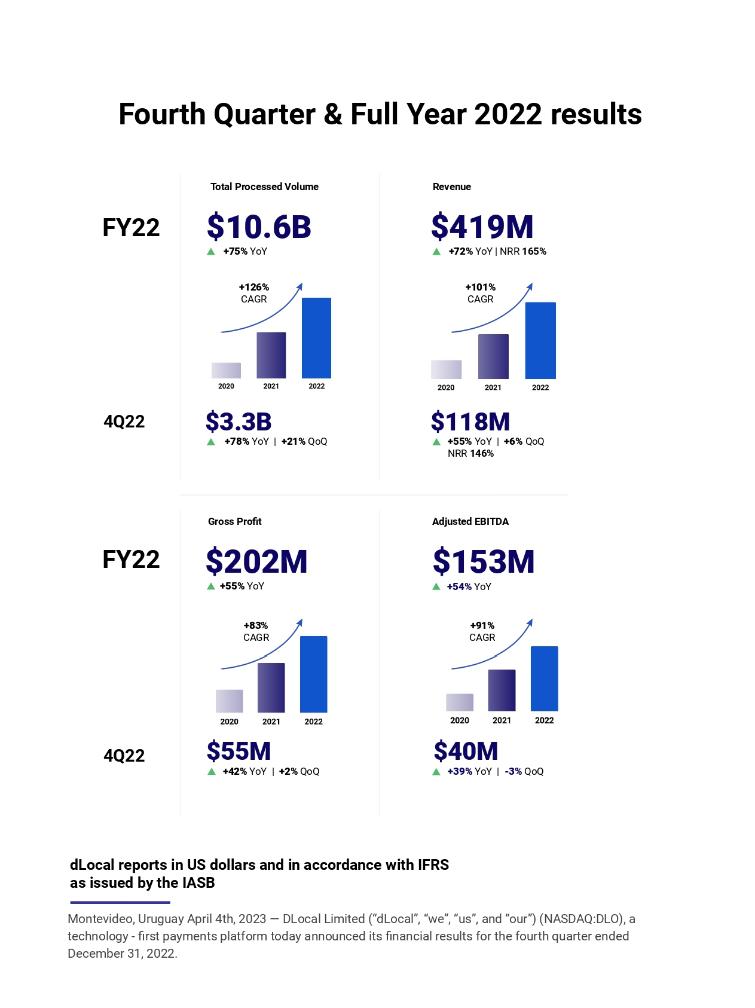
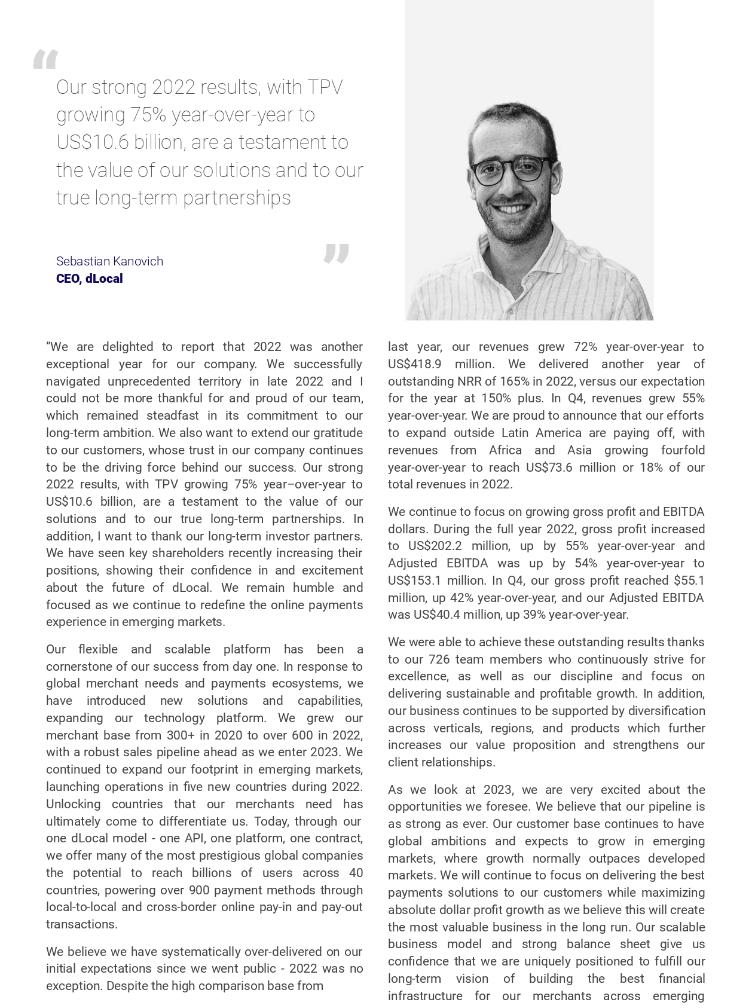
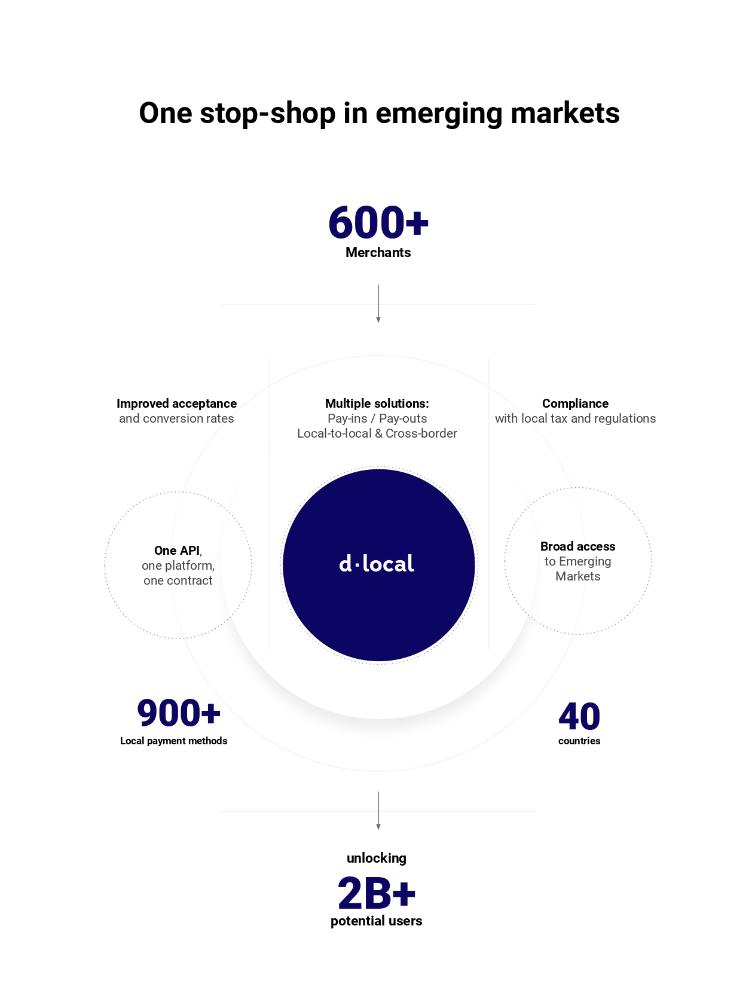
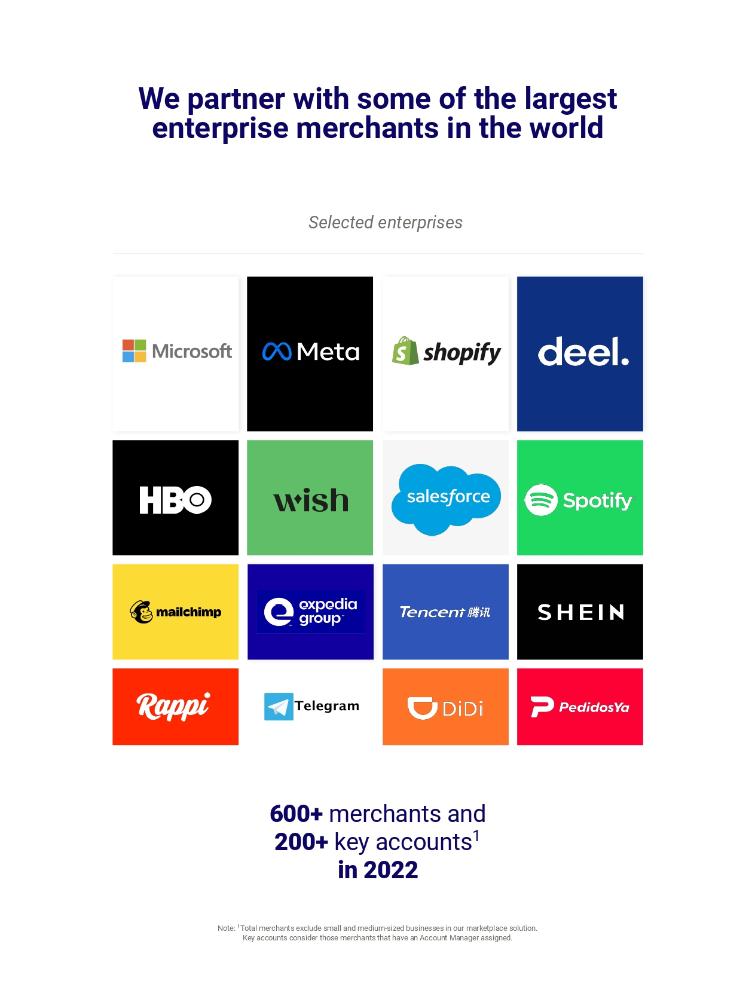
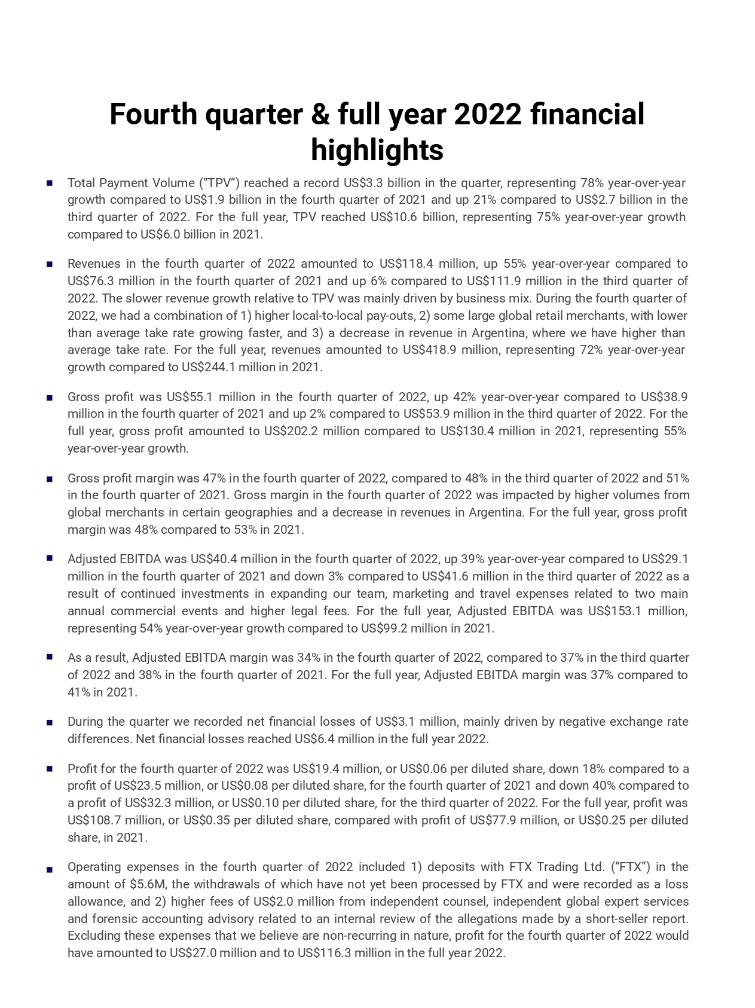
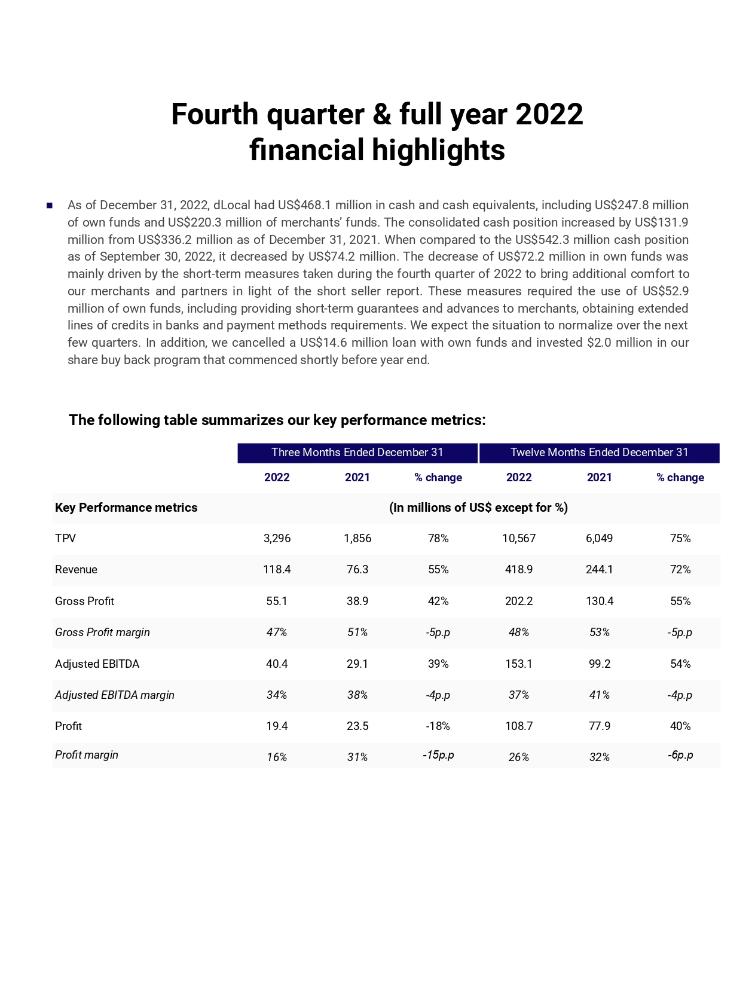
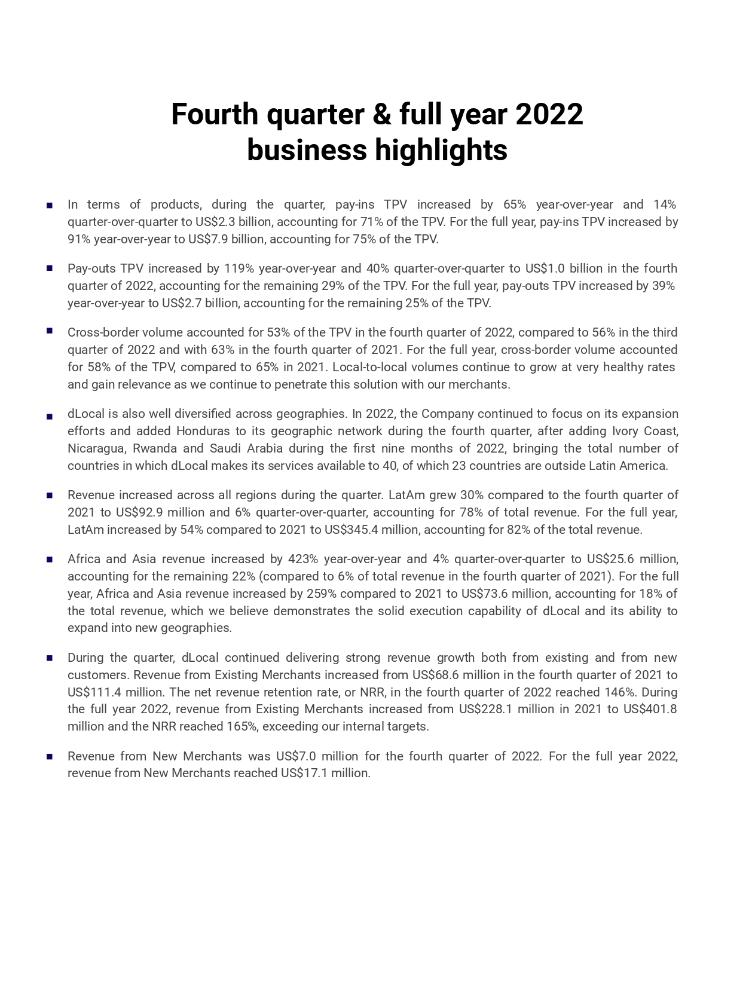
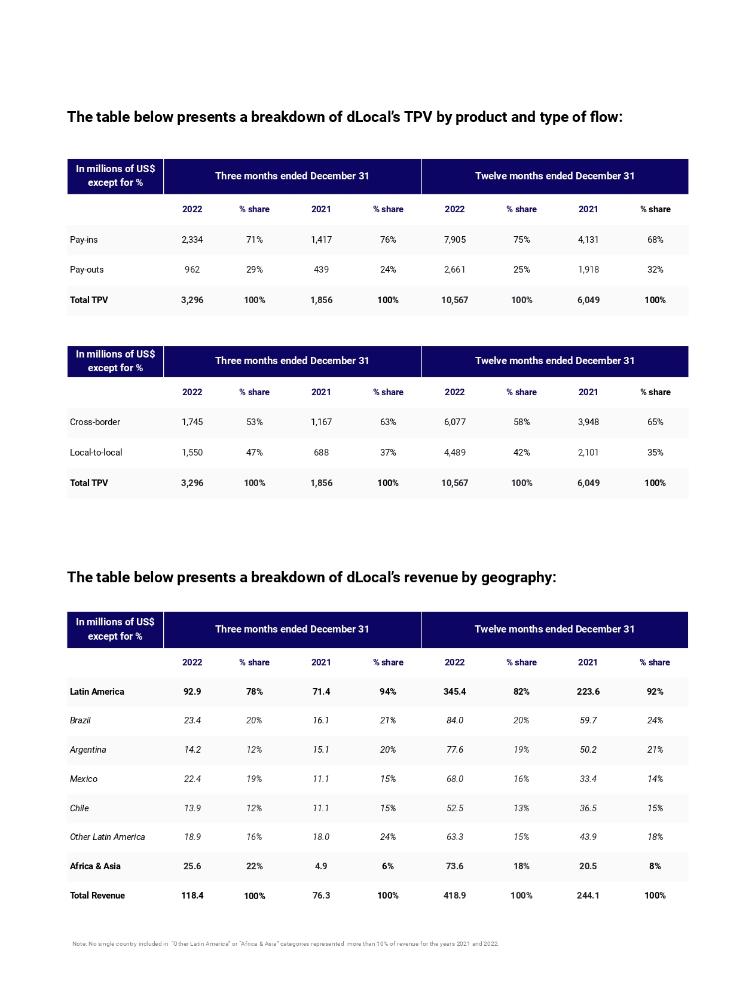

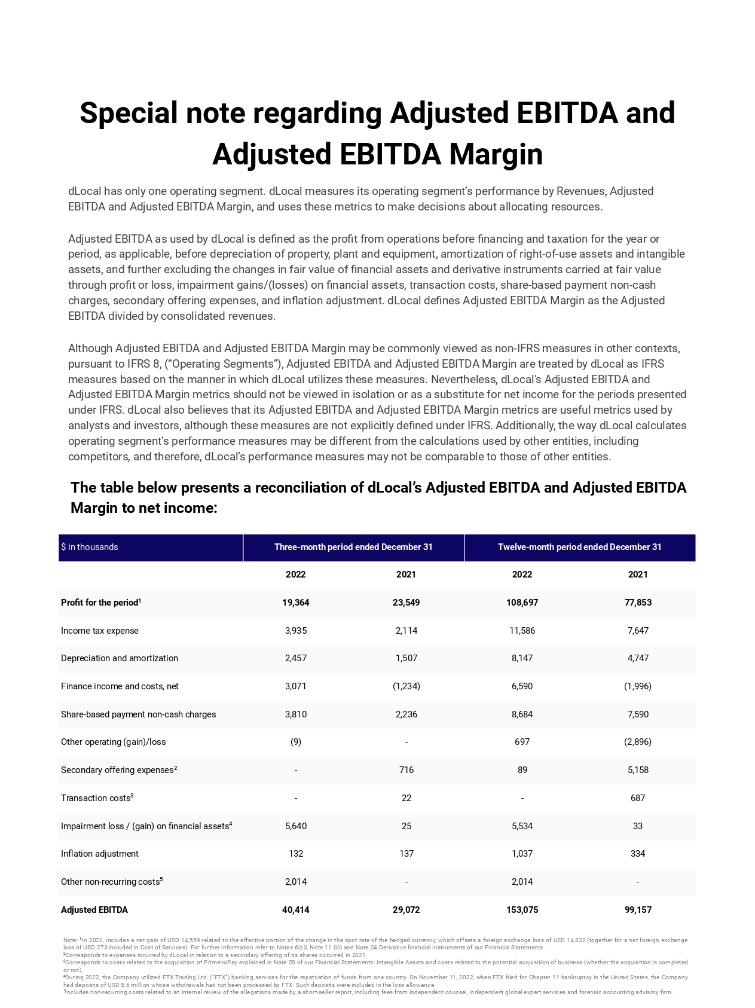
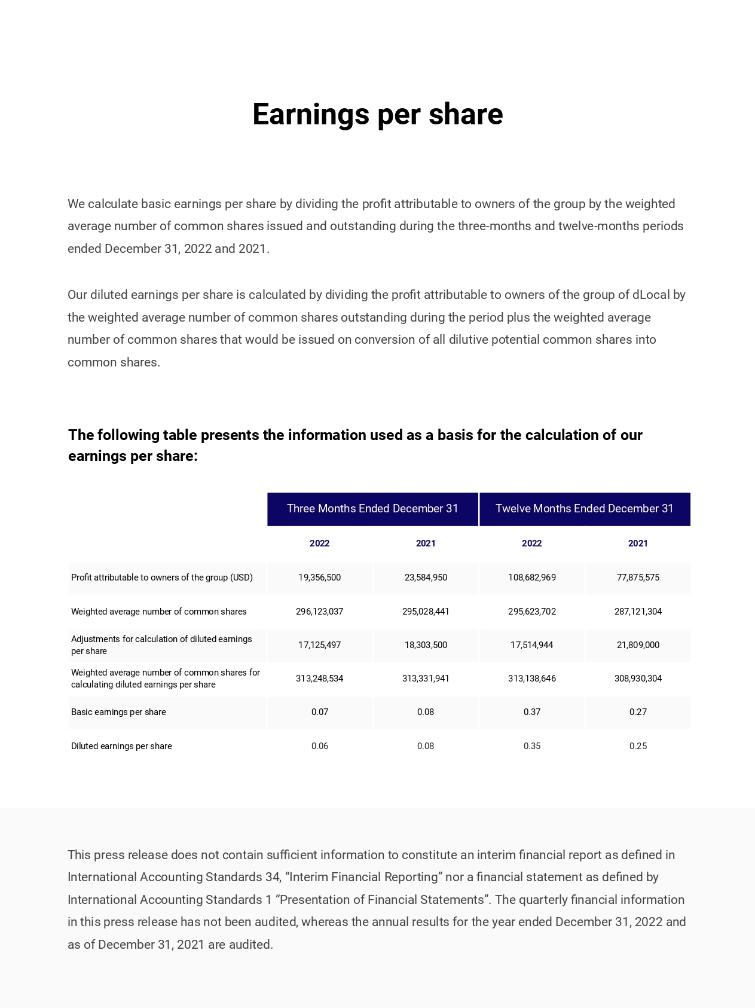
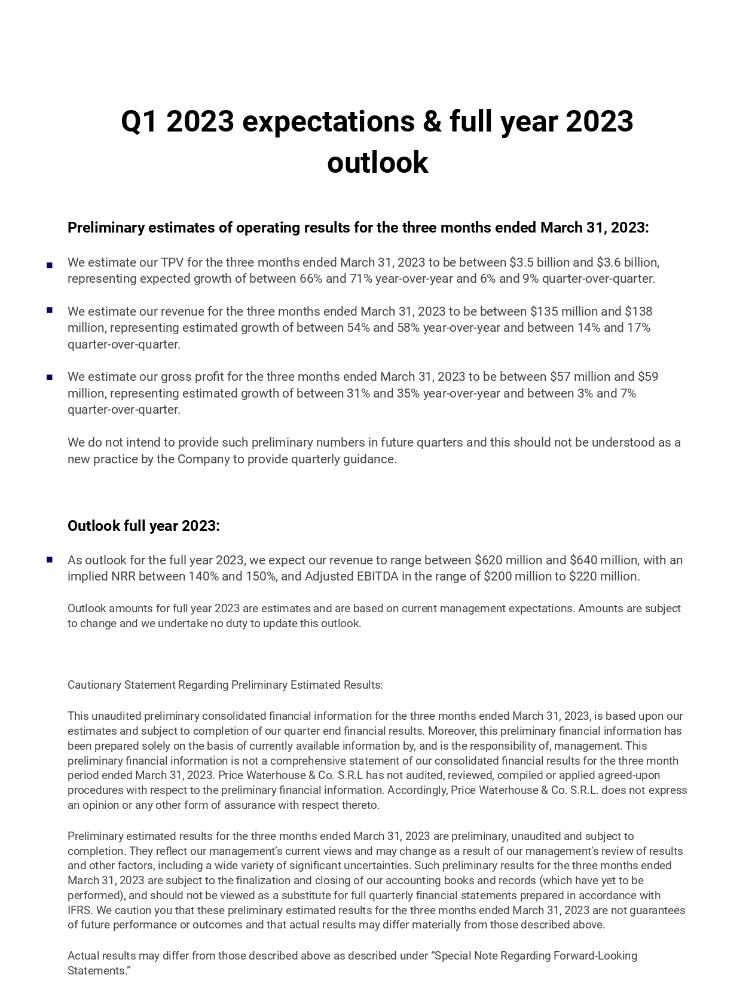
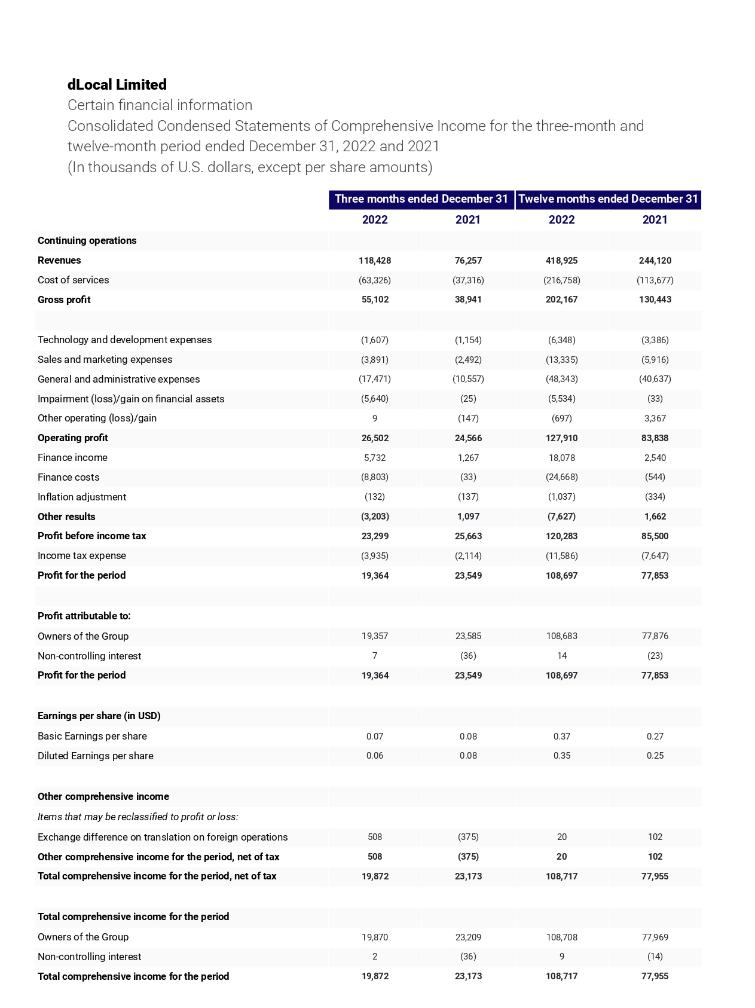
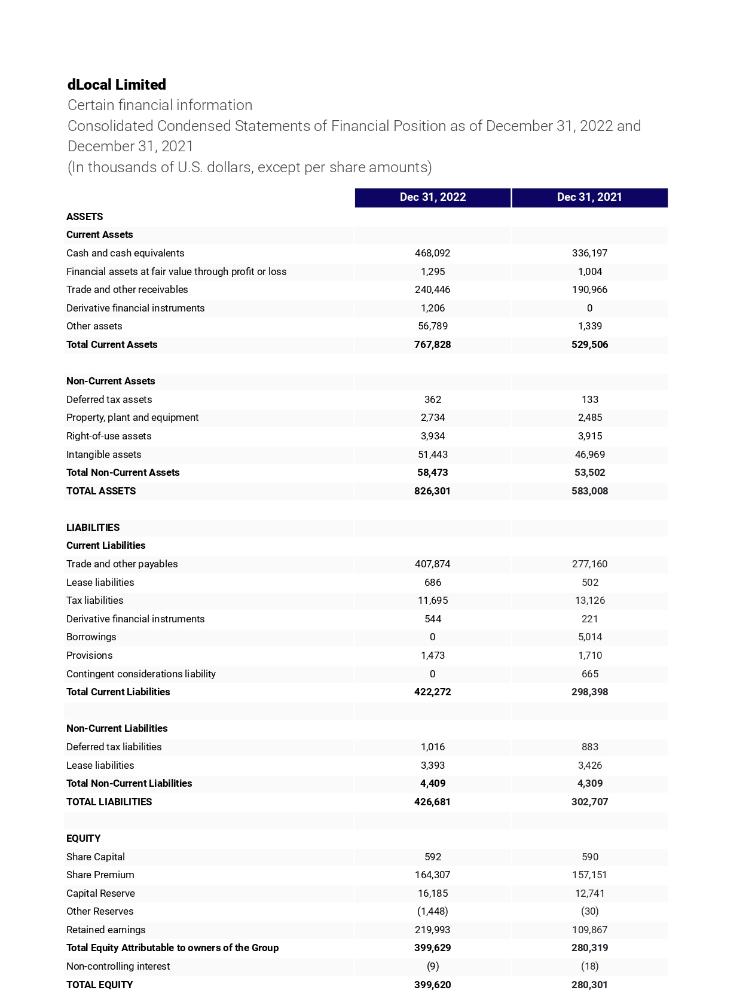

Exhibit 99.3